Recognising research software in academia
Nicholas Tierney, Telethon Kids Institute
UNSW Seminar
Friday 29th October, 2021
https://njt-rse-unsw.netlify.app
nj_tierney
Your Turn: What software do people use in their research?
Main arguments of the talk:
- We need software to do research
- Writing research software is a research contribution
- Research software is critically under-funded and not acknowledged.
- We will continue to lose software developers if they are not acknowledged.
- We must fund and acknowledge software
- What does a research software engineer do?
- The history of research software in academia
- What I do in a day to day role
- What Academia, and you, can do to help
I'll discuss why we need to consider software as academic output, what a research software engineer does, how I work in a team of researchers, and some of the practices I have put in place to maintain reproducibility.
Your Turn: Has anyone written software for their research and released it into the wild?
Main arguments of the talk:
- We need software to do research
- Writing research software is a research contribution
- Research software is critically under-funded and not acknowledged.
- We will continue to lose software developers if they are not acknowledged.
- We must fund and acknowledge software
- What does a research software engineer do?
- The history of research software in academia
- What I do in a day to day role
- What Academia, and you, can do to help
I'll discuss why we need to consider software as academic output, what a research software engineer does, how I work in a team of researchers, and some of the practices I have put in place to maintain reproducibility.
Your Turn: Could you do your research without software?
Main arguments of the talk:
- We need software to do research
- Writing research software is a research contribution
- Research software is critically under-funded and not acknowledged.
- We will continue to lose software developers if they are not acknowledged.
- We must fund and acknowledge software
- What does a research software engineer do?
- The history of research software in academia
- What I do in a day to day role
- What Academia, and you, can do to help
I'll discuss why we need to consider software as academic output, what a research software engineer does, how I work in a team of researchers, and some of the practices I have put in place to maintain reproducibility.
(R, Matlab, C, FORTRAN)
Do we need software to do our research?
Main arguments of the talk:
- We need software to do research
- Writing research software is a research contribution
- Research software is critically under-funded and not acknowledged.
- We will continue to lose software developers if they are not acknowledged.
- We must fund and acknowledge software
- What does a research software engineer do?
- The history of research software in academia
- What I do in a day to day role
- What Academia, and you, can do to help
I'll discuss why we need to consider software as academic output, what a research software engineer does, how I work in a team of researchers, and some of the practices I have put in place to maintain reproducibility.
Do we need software to do our research?
Yes
(if we want it to work)
Main arguments of the talk:
- We need software to do research
- Writing research software is a research contribution
- Research software is critically under-funded and not acknowledged.
- We will continue to lose software developers if they are not acknowledged.
- We must fund and acknowledge software
- What does a research software engineer do?
- The history of research software in academia
- What I do in a day to day role
- What Academia, and you, can do to help
I'll discuss why we need to consider software as academic output, what a research software engineer does, how I work in a team of researchers, and some of the practices I have put in place to maintain reproducibility.
Imaging a black hole
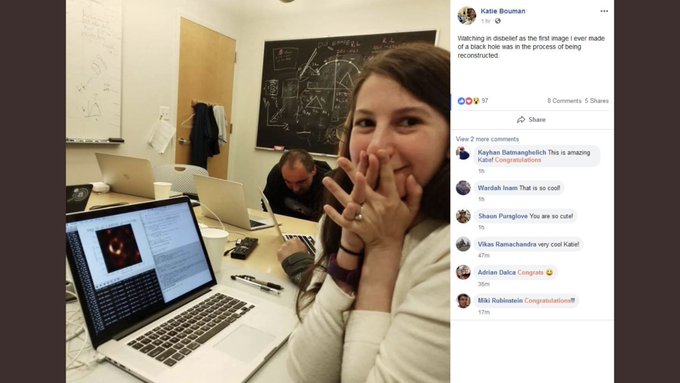
Congratulations to Dr. Katie Bouman to whom we owe the first photograph of a black hole ever. (from @TamyEmmaPepin
]
Main arguments of the talk:
- We need software to do research
- Writing research software is a research contribution
- Research software is critically under-funded and not acknowledged.
- We will continue to lose software developers if they are not acknowledged.
- We must fund and acknowledge software
- What does a research software engineer do?
- The history of research software in academia
- What I do in a day to day role
- What Academia, and you, can do to help
I'll discuss why we need to consider software as academic output, what a research software engineer does, how I work in a team of researchers, and some of the practices I have put in place to maintain reproducibility.
COVID19: Grattan Institute
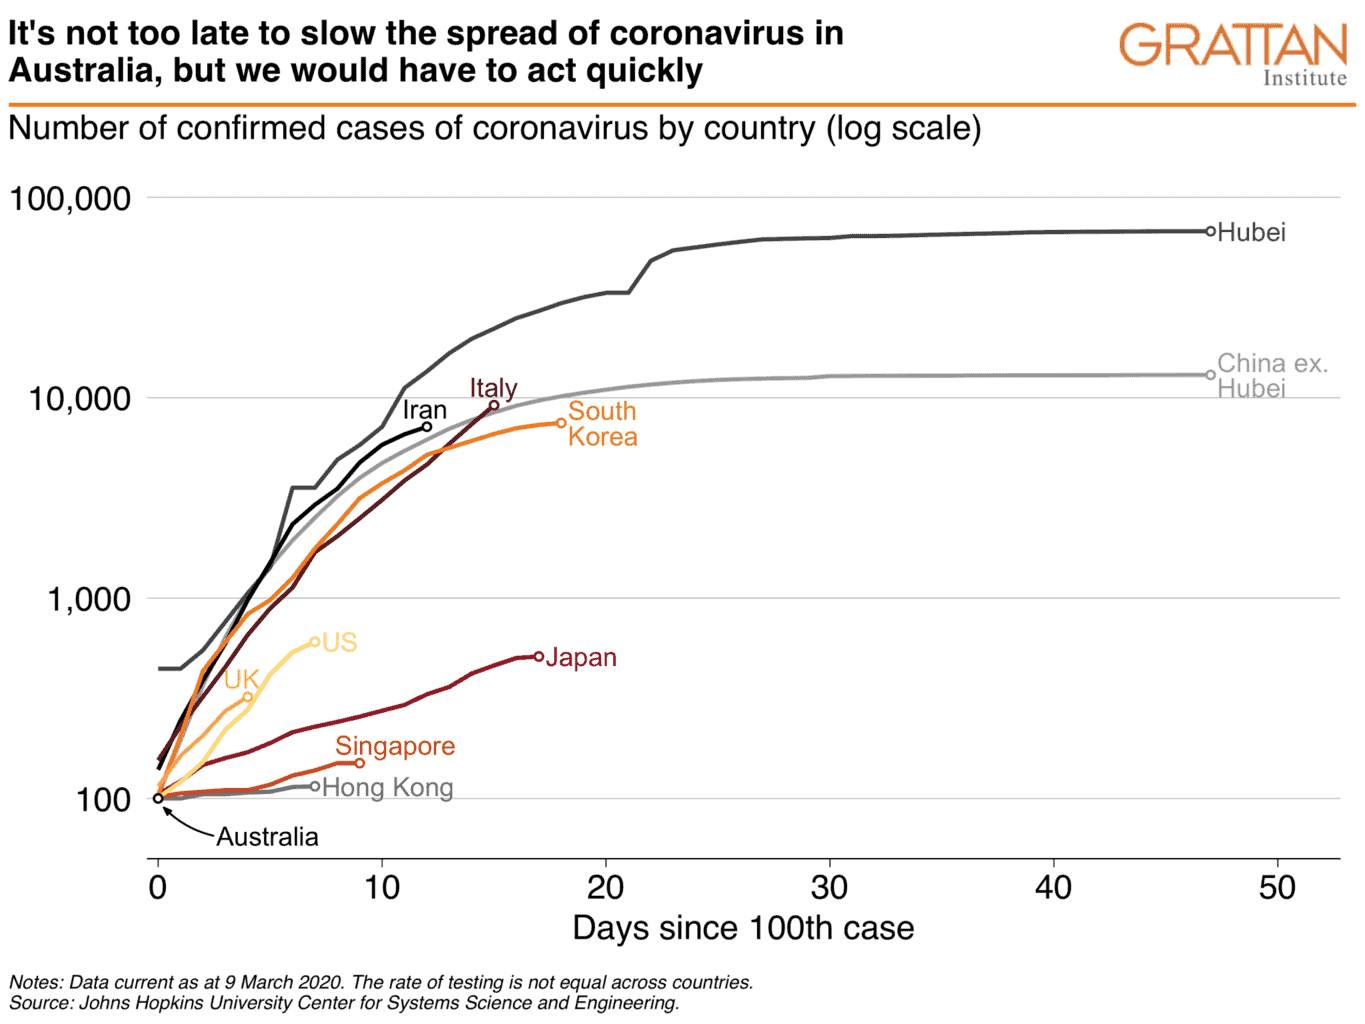
(from Grattan institute report: "Australian governments can choose to slow the spread of coronavirus, but they would need to act immediately")
Main arguments of the talk:
- We need software to do research
- Writing research software is a research contribution
- Research software is critically under-funded and not acknowledged.
- We will continue to lose software developers if they are not acknowledged.
- We must fund and acknowledge software
- What does a research software engineer do?
- The history of research software in academia
- What I do in a day to day role
- What Academia, and you, can do to help
I'll discuss why we need to consider software as academic output, what a research software engineer does, how I work in a team of researchers, and some of the practices I have put in place to maintain reproducibility.
Writing research software is a research contribution
Main arguments of the talk:
- We need software to do research
- Writing research software is a research contribution
- Research software is critically under-funded and not acknowledged.
- We will continue to lose software developers if they are not acknowledged.
- We must fund and acknowledge software
- What does a research software engineer do?
- The history of research software in academia
- What I do in a day to day role
- What Academia, and you, can do to help
I'll discuss why we need to consider software as academic output, what a research software engineer does, how I work in a team of researchers, and some of the practices I have put in place to maintain reproducibility.
Functions help us manage complexity
For example: R's model syntax
fit <- lm(y ~ x + factor(z))coef(fit)## (Intercept) x factor(z)2 factor(z)3 ## 0.15594165 -0.11102041 -0.17567974 -0.08798766fit |> residuals() |> summary()## Min. 1st Qu. Median Mean 3rd Qu. Max. ## -2.0688 -0.5884 0.0188 0.0000 0.5724 2.6394Main arguments of the talk:
- We need software to do research
- Writing research software is a research contribution
- Research software is critically under-funded and not acknowledged.
- We will continue to lose software developers if they are not acknowledged.
- We must fund and acknowledge software
- What does a research software engineer do?
- The history of research software in academia
- What I do in a day to day role
- What Academia, and you, can do to help
I'll discuss why we need to consider software as academic output, what a research software engineer does, how I work in a team of researchers, and some of the practices I have put in place to maintain reproducibility.
Functions help us manage complexity
Versus writing a model from scratch
X <- cbind(1, x, z == 2, z == 3)fit <- solve(t(X) %*% X) %*% t(X) %*% yresiduals(fit)## Error: $ operator is invalid for atomic vectors# ugh, residuals...Main arguments of the talk:
- We need software to do research
- Writing research software is a research contribution
- Research software is critically under-funded and not acknowledged.
- We will continue to lose software developers if they are not acknowledged.
- We must fund and acknowledge software
- What does a research software engineer do?
- The history of research software in academia
- What I do in a day to day role
- What Academia, and you, can do to help
I'll discuss why we need to consider software as academic output, what a research software engineer does, how I work in a team of researchers, and some of the practices I have put in place to maintain reproducibility.
(which is actually a syntactic algebra from a paper ... (heard via Emi Tanaka))
Functions help us manage complexity
leaflet() %>% addTiles() %>% addMarkers( lng = 174.768, lat = -36.852, popup = "R's birthplace" )


Main arguments of the talk:
- We need software to do research
- Writing research software is a research contribution
- Research software is critically under-funded and not acknowledged.
- We will continue to lose software developers if they are not acknowledged.
- We must fund and acknowledge software
- What does a research software engineer do?
- The history of research software in academia
- What I do in a day to day role
- What Academia, and you, can do to help
I'll discuss why we need to consider software as academic output, what a research software engineer does, how I work in a team of researchers, and some of the practices I have put in place to maintain reproducibility.
Functions allow you to abstract complexity so you can individually reason with them
Assembly --> C --> R --> ggplot
Abstraction of complexity: similarities between software and maths
Main arguments of the talk:
- We need software to do research
- Writing research software is a research contribution
- Research software is critically under-funded and not acknowledged.
- We will continue to lose software developers if they are not acknowledged.
- We must fund and acknowledge software
- What does a research software engineer do?
- The history of research software in academia
- What I do in a day to day role
- What Academia, and you, can do to help
I'll discuss why we need to consider software as academic output, what a research software engineer does, how I work in a team of researchers, and some of the practices I have put in place to maintain reproducibility.
Abstraction of complexity: similarities between software and maths
Users often remark on the ease of manipulating data with dplyr and it is natural to wonder if perhaps the task itself is trivial. We claim it is not. Many probability challenges become dramatically easier, once you strike upon the "right" notation. In both cases, what feels like a matter of notation or syntax is really more about exploiting the "right" abstraction.
-- Jenny Bryan & Hadley Wickham Data Science: A Three Ring Circus or a Big Tent?
Main arguments of the talk:
- We need software to do research
- Writing research software is a research contribution
- Research software is critically under-funded and not acknowledged.
- We will continue to lose software developers if they are not acknowledged.
- We must fund and acknowledge software
- What does a research software engineer do?
- The history of research software in academia
- What I do in a day to day role
- What Academia, and you, can do to help
I'll discuss why we need to consider software as academic output, what a research software engineer does, how I work in a team of researchers, and some of the practices I have put in place to maintain reproducibility.
This means that it is not just statistical models, but things like dplyr, ggplot
Abstraction of complexity: similarities between software and maths
Notation matters!
Main arguments of the talk:
- We need software to do research
- Writing research software is a research contribution
- Research software is critically under-funded and not acknowledged.
- We will continue to lose software developers if they are not acknowledged.
- We must fund and acknowledge software
- What does a research software engineer do?
- The history of research software in academia
- What I do in a day to day role
- What Academia, and you, can do to help
I'll discuss why we need to consider software as academic output, what a research software engineer does, how I work in a team of researchers, and some of the practices I have put in place to maintain reproducibility.
Abstraction of complexity: similarities between software and maths
Notation matters!
1000000 vs 1,000,000 vs 106
1000000∗10000∗10000000∗10000=?
106∗104∗107∗104=106+4+7+4
Main arguments of the talk:
- We need software to do research
- Writing research software is a research contribution
- Research software is critically under-funded and not acknowledged.
- We will continue to lose software developers if they are not acknowledged.
- We must fund and acknowledge software
- What does a research software engineer do?
- The history of research software in academia
- What I do in a day to day role
- What Academia, and you, can do to help
I'll discuss why we need to consider software as academic output, what a research software engineer does, how I work in a team of researchers, and some of the practices I have put in place to maintain reproducibility.
Abstraction of complexity: similarities between software and maths
"Unmasking the theta method" (Rob Hyndman & Baki Billah)
The "Theta method" of forecasting performed particularly well in the M3- competition and is therefore of interest to forecast practitioners. The original description of the method given by Assimakopoulos and Nikolopoulos (2000) involves several pages of algebraic manipulation. We show that the method can be expressed much more simply and that the forecasts obtained are equivalent to simple exponential smoothing with drift.
Main arguments of the talk:
- We need software to do research
- Writing research software is a research contribution
- Research software is critically under-funded and not acknowledged.
- We will continue to lose software developers if they are not acknowledged.
- We must fund and acknowledge software
- What does a research software engineer do?
- The history of research software in academia
- What I do in a day to day role
- What Academia, and you, can do to help
I'll discuss why we need to consider software as academic output, what a research software engineer does, how I work in a team of researchers, and some of the practices I have put in place to maintain reproducibility.
Research software is critically underfunded and not acknowledged
Main arguments of the talk:
- We need software to do research
- Writing research software is a research contribution
- Research software is critically under-funded and not acknowledged.
- We will continue to lose software developers if they are not acknowledged.
- We must fund and acknowledge software
- What does a research software engineer do?
- The history of research software in academia
- What I do in a day to day role
- What Academia, and you, can do to help
I'll discuss why we need to consider software as academic output, what a research software engineer does, how I work in a team of researchers, and some of the practices I have put in place to maintain reproducibility.
We continue to lose people
Every great open source math library is built on the ashes of someone's academic career
Main arguments of the talk:
- We need software to do research
- Writing research software is a research contribution
- Research software is critically under-funded and not acknowledged.
- We will continue to lose software developers if they are not acknowledged.
- We must fund and acknowledge software
- What does a research software engineer do?
- The history of research software in academia
- What I do in a day to day role
- What Academia, and you, can do to help
I'll discuss why we need to consider software as academic output, what a research software engineer does, how I work in a team of researchers, and some of the practices I have put in place to maintain reproducibility.
William Stein
"The origins of SageMath - I am leaving academia to build a company"
- 1991-93: CS Undergrad
- 1997-99: Hecke + interpreter in C++
- 1998: Kohel: Introduced me to both "open source" and Magma, and said "too bad you have to write an interpreter"...
- 1999-2004: wrote a lot of Magma code (3 Sydney visits), and tried to convert everyone I met to using Magma.
- 2004: Problems: Magma is closed source, closed development model, expensive; authorship issues
- 2005: created SageMath
- 2016: Left academia to work full time on Sage
Main arguments of the talk:
- We need software to do research
- Writing research software is a research contribution
- Research software is critically under-funded and not acknowledged.
- We will continue to lose software developers if they are not acknowledged.
- We must fund and acknowledge software
- What does a research software engineer do?
- The history of research software in academia
- What I do in a day to day role
- What Academia, and you, can do to help
I'll discuss why we need to consider software as academic output, what a research software engineer does, how I work in a team of researchers, and some of the practices I have put in place to maintain reproducibility.
Travis Oliphant
- PhD 2001 from Mayo Clinic in Biomedical Engineering
- MS/BS in Elec. Comp. Engineering
- Creator of
SciPy, Author ofNumPy(The most imported machine learning projects on GitHub) - Founding chair of Numfocus / PyData
- Professor at Brigham Young University (2001-2007)
Application for Tenure was denied. Software wasn't counted.
(Abbreviated from William Stein's talk)
Main arguments of the talk:
- We need software to do research
- Writing research software is a research contribution
- Research software is critically under-funded and not acknowledged.
- We will continue to lose software developers if they are not acknowledged.
- We must fund and acknowledge software
- What does a research software engineer do?
- The history of research software in academia
- What I do in a day to day role
- What Academia, and you, can do to help
I'll discuss why we need to consider software as academic output, what a research software engineer does, how I work in a team of researchers, and some of the practices I have put in place to maintain reproducibility.
Also worth noting that he has had a successful career from here, his company, Continuum Analytics received 24 million dollars in Seris A funding.
Jack Poulson
Hi William,
I am sitting on an offer from Google and am increasingly frustrated by continual evidence that it is more valuable to publish a litany of computational papers with no source code than to do the thankless task of developing a niche open source library. Deep mathematical software is not appreciated by either the mathematicians or the public. I had been on the fence about accepting the offer, and this conversation led to me making the difficult decision.
(Abbreviated from William Stein's talk)
Main arguments of the talk:
- We need software to do research
- Writing research software is a research contribution
- Research software is critically under-funded and not acknowledged.
- We will continue to lose software developers if they are not acknowledged.
- We must fund and acknowledge software
- What does a research software engineer do?
- The history of research software in academia
- What I do in a day to day role
- What Academia, and you, can do to help
I'll discuss why we need to consider software as academic output, what a research software engineer does, how I work in a team of researchers, and some of the practices I have put in place to maintain reproducibility.
It should be noted that Jack appears to be doing well, had a successful career at Google and has his own company, HodgeStar
"The Astropy problem" (paper)
"[Astropy is] a community effort to develop a single core package for Astronomy in Python and foster interoperability between Python astronomy packages."
Main arguments of the talk:
- We need software to do research
- Writing research software is a research contribution
- Research software is critically under-funded and not acknowledged.
- We will continue to lose software developers if they are not acknowledged.
- We must fund and acknowledge software
- What does a research software engineer do?
- The history of research software in academia
- What I do in a day to day role
- What Academia, and you, can do to help
I'll discuss why we need to consider software as academic output, what a research software engineer does, how I work in a team of researchers, and some of the practices I have put in place to maintain reproducibility.
"The Astropy problem" (paper)
"[Astropy is] a community effort to develop a single core package for Astronomy in Python and foster interoperability between Python astronomy packages."
For five years this project has been managed, written, and operated as a grassroots, self-organized, almost entirely volunteer effort while the software is used by the majority of the astronomical community.
Despite this, the project has always been and remains to this day effectively unfunded . Further, contributors receive little or no formal recognition for creating and supporting what is now critical software.
Main arguments of the talk:
- We need software to do research
- Writing research software is a research contribution
- Research software is critically under-funded and not acknowledged.
- We will continue to lose software developers if they are not acknowledged.
- We must fund and acknowledge software
- What does a research software engineer do?
- The history of research software in academia
- What I do in a day to day role
- What Academia, and you, can do to help
I'll discuss why we need to consider software as academic output, what a research software engineer does, how I work in a team of researchers, and some of the practices I have put in place to maintain reproducibility.
Could grant bodies fund Astropy?
..."the NSF hasn't funded software development for many years now, yet software continues to be written, so...?"
"[The NSF] would consider funding software, but only once it has reached the point where it's very mature and has a large number of users."
These opinions reflect a gross misunderstanding of the amount of time, effort, and expertise it takes to develop software, let alone specialized, scientific software.
Main arguments of the talk:
- We need software to do research
- Writing research software is a research contribution
- Research software is critically under-funded and not acknowledged.
- We will continue to lose software developers if they are not acknowledged.
- We must fund and acknowledge software
- What does a research software engineer do?
- The history of research software in academia
- What I do in a day to day role
- What Academia, and you, can do to help
I'll discuss why we need to consider software as academic output, what a research software engineer does, how I work in a team of researchers, and some of the practices I have put in place to maintain reproducibility.
OK, but how important is astropy?
... All NASA mission pipelines... [such as the]... venerable Hubble Space Telescope to the upcoming [Nancy Grace Roman Space Telescope], use Astropy.

Main arguments of the talk:
- We need software to do research
- Writing research software is a research contribution
- Research software is critically under-funded and not acknowledged.
- We will continue to lose software developers if they are not acknowledged.
- We must fund and acknowledge software
- What does a research software engineer do?
- The history of research software in academia
- What I do in a day to day role
- What Academia, and you, can do to help
I'll discuss why we need to consider software as academic output, what a research software engineer does, how I work in a team of researchers, and some of the practices I have put in place to maintain reproducibility.
'...Software just, "happens" ???'
For much of the community, software is something that just "happens" and is expected to be free.
However, there is a cost and it is clear who is paying it.
The early career astronomers who contribute the lion's share of the effort do so at the expense of their research and publication output.
Main arguments of the talk:
- We need software to do research
- Writing research software is a research contribution
- Research software is critically under-funded and not acknowledged.
- We will continue to lose software developers if they are not acknowledged.
- We must fund and acknowledge software
- What does a research software engineer do?
- The history of research software in academia
- What I do in a day to day role
- What Academia, and you, can do to help
I'll discuss why we need to consider software as academic output, what a research software engineer does, how I work in a team of researchers, and some of the practices I have put in place to maintain reproducibility.
Who is funding scientific software?



Main arguments of the talk:
- We need software to do research
- Writing research software is a research contribution
- Research software is critically under-funded and not acknowledged.
- We will continue to lose software developers if they are not acknowledged.
- We must fund and acknowledge software
- What does a research software engineer do?
- The history of research software in academia
- What I do in a day to day role
- What Academia, and you, can do to help
I'll discuss why we need to consider software as academic output, what a research software engineer does, how I work in a team of researchers, and some of the practices I have put in place to maintain reproducibility.
What happens if you don't fund software
By 2014, two-thirds of all Web servers were using OpenSSL, enabling websites to securely pass credit card and other sensitive information over the Internet
...the project continued to be informally managed by a small handful of volunteers.
... a Google engineer named Neel Mehta stumbled upon a major flaw in OpenSSL's software...
(from "Roads and Bridges: The Unseen Labor Behind Our Digital Infrastructure)
Main arguments of the talk:
- We need software to do research
- Writing research software is a research contribution
- Research software is critically under-funded and not acknowledged.
- We will continue to lose software developers if they are not acknowledged.
- We must fund and acknowledge software
- What does a research software engineer do?
- The history of research software in academia
- What I do in a day to day role
- What Academia, and you, can do to help
I'll discuss why we need to consider software as academic output, what a research software engineer does, how I work in a team of researchers, and some of the practices I have put in place to maintain reproducibility.
What happens if you don't fund software
That bug, nicknamed Heartbleed, had been included in a 2011 update. It had gone unnoticed for years. Heartbleed could allow any sophisticated hacker to capture secure information being passed to vulnerable web servers, including passwords, credit card information, and other sensitive data.
The mystery is not that a few overworked volunteers missed this bug; the mystery is why it hasn't happened more often."
(from "Roads and Bridges: The Unseen Labor Behind Our Digital Infrastructure)
Main arguments of the talk:
- We need software to do research
- Writing research software is a research contribution
- Research software is critically under-funded and not acknowledged.
- We will continue to lose software developers if they are not acknowledged.
- We must fund and acknowledge software
- What does a research software engineer do?
- The history of research software in academia
- What I do in a day to day role
- What Academia, and you, can do to help
I'll discuss why we need to consider software as academic output, what a research software engineer does, how I work in a team of researchers, and some of the practices I have put in place to maintain reproducibility.
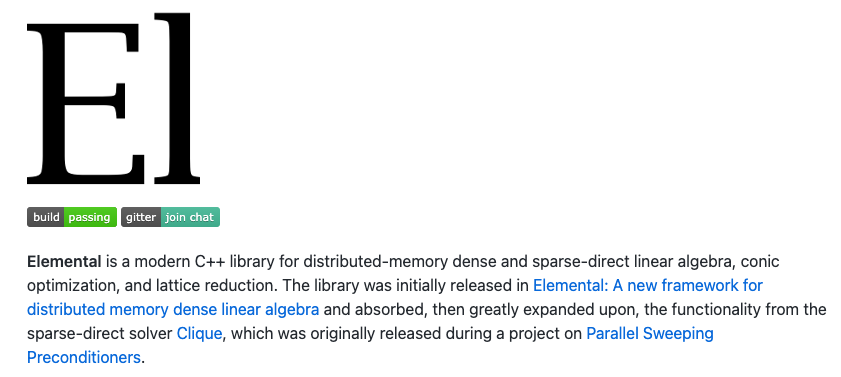
elemental C++ library for distributed-memory dense and sparse-direct linear algebra, conic optimization, and lattice reduction
Research: "done" vs Software: "Maintained"
Main arguments of the talk:
- We need software to do research
- Writing research software is a research contribution
- Research software is critically under-funded and not acknowledged.
- We will continue to lose software developers if they are not acknowledged.
- We must fund and acknowledge software
- What does a research software engineer do?
- The history of research software in academia
- What I do in a day to day role
- What Academia, and you, can do to help
I'll discuss why we need to consider software as academic output, what a research software engineer does, how I work in a team of researchers, and some of the practices I have put in place to maintain reproducibility.
Research: "done" vs Software: "Maintained"
Research:
- 3 year research plan
- Survey population
- Get + share data
- Develop model, write about insights
- Submit paper
- reject/revise/publish
- paper published
- That component is done
Software:
- 3 years of funding
- Create software to perform modelling
- Develop tests, documentation, examples
- Extend to other niche use cases
- Add features requested by community
- Ongoing maintenance
Main arguments of the talk:
- We need software to do research
- Writing research software is a research contribution
- Research software is critically under-funded and not acknowledged.
- We will continue to lose software developers if they are not acknowledged.
- We must fund and acknowledge software
- What does a research software engineer do?
- The history of research software in academia
- What I do in a day to day role
- What Academia, and you, can do to help
I'll discuss why we need to consider software as academic output, what a research software engineer does, how I work in a team of researchers, and some of the practices I have put in place to maintain reproducibility.
Can we at least give software developers in academia a name?
A research software engineer!
Main arguments of the talk:
- We need software to do research
- Writing research software is a research contribution
- Research software is critically under-funded and not acknowledged.
- We will continue to lose software developers if they are not acknowledged.
- We must fund and acknowledge software
- What does a research software engineer do?
- The history of research software in academia
- What I do in a day to day role
- What Academia, and you, can do to help
I'll discuss why we need to consider software as academic output, what a research software engineer does, how I work in a team of researchers, and some of the practices I have put in place to maintain reproducibility.
A not-so-brief history of Research Software Engineers (Abridged)
Many academics were aware of the importance of software to research; they could see that the people who created this software went largely unrecognised, and they were beginning to worry about the consequences of this oversight. What happens when something is so vital to research, yet overlooked and severely under-resourced?
(From the eponymous paper)
Main arguments of the talk:
- We need software to do research
- Writing research software is a research contribution
- Research software is critically under-funded and not acknowledged.
- We will continue to lose software developers if they are not acknowledged.
- We must fund and acknowledge software
- What does a research software engineer do?
- The history of research software in academia
- What I do in a day to day role
- What Academia, and you, can do to help
I'll discuss why we need to consider software as academic output, what a research software engineer does, how I work in a team of researchers, and some of the practices I have put in place to maintain reproducibility.
Define: Research Software Engineer
A Research Software Engineer (RSE) combines professional software engineering expertise with an intimate understanding of research.
-- (from https://society-rse.org/about/)
The Society of Research Software Engineering was founded on the belief that a world which relies on software must recognise the people who develop it.
Main arguments of the talk:
- We need software to do research
- Writing research software is a research contribution
- Research software is critically under-funded and not acknowledged.
- We will continue to lose software developers if they are not acknowledged.
- We must fund and acknowledge software
- What does a research software engineer do?
- The history of research software in academia
- What I do in a day to day role
- What Academia, and you, can do to help
I'll discuss why we need to consider software as academic output, what a research software engineer does, how I work in a team of researchers, and some of the practices I have put in place to maintain reproducibility.
Research software engineer vs Software Engineer
Researcher
- Create statistical model of malaria for given region
Software engineer:
- Take existing code base, and productionise in containers to run on the web
Research software engineer:
- Identify abstractions, create software that lets researchers write code focussing on the models
Main arguments of the talk:
- We need software to do research
- Writing research software is a research contribution
- Research software is critically under-funded and not acknowledged.
- We will continue to lose software developers if they are not acknowledged.
- We must fund and acknowledge software
- What does a research software engineer do?
- The history of research software in academia
- What I do in a day to day role
- What Academia, and you, can do to help
I'll discuss why we need to consider software as academic output, what a research software engineer does, how I work in a team of researchers, and some of the practices I have put in place to maintain reproducibility.
Malaria modelling
yahtsee (Yet Another Hierarchical Time Series Extension + Expansion)
m <- fit_hts( formula = pr ~ avg_lower_age + hts(who_region, who_subregion, country), .data = malaria_africa_ts, family = "gaussian")## # A tsibble: 1,046 x 15 [1D]## # Key: country [46]## who_region who_subregion country date month_num positive examined## <fct> <fct> <fct> <date> <dbl> <dbl> <int>## 1 AFRO AFRO-W Angola 1989-06-01 120 15.8 50## 2 AFRO AFRO-W Angola 2005-11-01 372 82 111## 3 AFRO AFRO-W Angola 2006-04-01 300 102 197## 4 AFRO AFRO-W Angola 2006-11-01 384 41 347## 5 AFRO AFRO-W Angola 2006-12-01 396 173 734## 6 AFRO AFRO-W Angola 2007-01-01 276 216 828## 7 AFRO AFRO-W Angola 2007-02-01 288 42 71## 8 AFRO AFRO-W Angola 2007-03-01 300 119 448## 9 AFRO AFRO-W Angola 2011-01-01 324 1 239## 10 AFRO AFRO-W Angola 2011-02-01 336 148 1132## # … with 1,036 more rows, and 8 more variables: pr <dbl>, avg_lower_age <dbl>,## # continent_id <fct>, country_id <fct>, year <int>, month <int>,## # avg_upper_age <dbl>, species <fct>Main arguments of the talk:
- We need software to do research
- Writing research software is a research contribution
- Research software is critically under-funded and not acknowledged.
- We will continue to lose software developers if they are not acknowledged.
- We must fund and acknowledge software
- What does a research software engineer do?
- The history of research software in academia
- What I do in a day to day role
- What Academia, and you, can do to help
I'll discuss why we need to consider software as academic output, what a research software engineer does, how I work in a team of researchers, and some of the practices I have put in place to maintain reproducibility.
Malaria modelling
cleaned_data <- data %>% as_tibble() %>% group_by(who_region) %>% transmute(.who_region_id = cur_group_id()) %>% ungroup(who_region) %>% select(-who_region) %>% group_by(who_subregion) %>% transmute(.who_subregion_id = cur_group_id()) %>% ungroup(who_subregion) %>% select(-who_subregion) %>% group_by(country) %>% transmute(.country_id = cur_group_id()) %>% ungroup(country) %>% select(-country)Main arguments of the talk:
- We need software to do research
- Writing research software is a research contribution
- Research software is critically under-funded and not acknowledged.
- We will continue to lose software developers if they are not acknowledged.
- We must fund and acknowledge software
- What does a research software engineer do?
- The history of research software in academia
- What I do in a day to day role
- What Academia, and you, can do to help
I'll discuss why we need to consider software as academic output, what a research software engineer does, how I work in a team of researchers, and some of the practices I have put in place to maintain reproducibility.
Malaria modelling
model <- inlabru::bru(formula = pr ~ avg_lower_age + Intercept + who_region(month_num, model = "ar1", group = .who_region_id, constr = FALSE) + who_subregion(month_num, model = "ar1", group = .who_subregion_id, constr = FALSE) + country(month_num, model = "ar1", group = .country_id, constr = FALSE), family = "gaussian", data = malaria_africa_ts, options = list(control.compute = list(config = TRUE), control.predictor = list(compute = TRUE, link = 1)) )Main arguments of the talk:
- We need software to do research
- Writing research software is a research contribution
- Research software is critically under-funded and not acknowledged.
- We will continue to lose software developers if they are not acknowledged.
- We must fund and acknowledge software
- What does a research software engineer do?
- The history of research software in academia
- What I do in a day to day role
- What Academia, and you, can do to help
I'll discuss why we need to consider software as academic output, what a research software engineer does, how I work in a team of researchers, and some of the practices I have put in place to maintain reproducibility.
Malaria modelling
yahtsee (Yet Another Hierarchical Time Series Extension + Expansion)
m <- fit_hts( formula = pr ~ avg_lower_age + hts(who_region, who_subregion, country), .data = malaria_africa_ts, family = "gaussian")Main arguments of the talk:
- We need software to do research
- Writing research software is a research contribution
- Research software is critically under-funded and not acknowledged.
- We will continue to lose software developers if they are not acknowledged.
- We must fund and acknowledge software
- What does a research software engineer do?
- The history of research software in academia
- What I do in a day to day role
- What Academia, and you, can do to help
I'll discuss why we need to consider software as academic output, what a research software engineer does, how I work in a team of researchers, and some of the practices I have put in place to maintain reproducibility.
What sorts of things does an RSE do?
- Create software to solve research problems
- Develop tools that abstract the right components to facilitate research
- Help researchers to find and learn good tools
- Support researchers with (computational) reproducibility
(adapted from Heidi Seibold's UseR2021 Keynote talk)
Main arguments of the talk:
- We need software to do research
- Writing research software is a research contribution
- Research software is critically under-funded and not acknowledged.
- We will continue to lose software developers if they are not acknowledged.
- We must fund and acknowledge software
- What does a research software engineer do?
- The history of research software in academia
- What I do in a day to day role
- What Academia, and you, can do to help
I'll discuss why we need to consider software as academic output, what a research software engineer does, how I work in a team of researchers, and some of the practices I have put in place to maintain reproducibility.
My journey into the RSE world
2008-2012: Undergraduate + honours in Psychology
2013 - 2017: PhD Statistics
- Exploratory Data Analysis (EDA)
- Bayesian Statistics
2018 - 2020: Research Fellow / Lecturer at Monash
- Design and improve tools for (exploratory) data analysis
- Teach introduction to data analysis (ETC1010)
Main arguments of the talk:
- We need software to do research
- Writing research software is a research contribution
- Research software is critically under-funded and not acknowledged.
- We will continue to lose software developers if they are not acknowledged.
- We must fund and acknowledge software
- What does a research software engineer do?
- The history of research software in academia
- What I do in a day to day role
- What Academia, and you, can do to help
I'll discuss why we need to consider software as academic output, what a research software engineer does, how I work in a team of researchers, and some of the practices I have put in place to maintain reproducibility.
EDA: Exploratory Data Analysis
...EDA is an approach to analyzing data sets to summarize their main characteristics, often with visual methods. (Wikipedia)
John Tukey, Frederick Mosteller, Bill Cleveland, Dianne Cook, Heike Hoffman, Rob Hyndman, Hadley Wickham
Main arguments of the talk:
- We need software to do research
- Writing research software is a research contribution
- Research software is critically under-funded and not acknowledged.
- We will continue to lose software developers if they are not acknowledged.
- We must fund and acknowledge software
- What does a research software engineer do?
- The history of research software in academia
- What I do in a day to day role
- What Academia, and you, can do to help
I'll discuss why we need to consider software as academic output, what a research software engineer does, how I work in a team of researchers, and some of the practices I have put in place to maintain reproducibility.
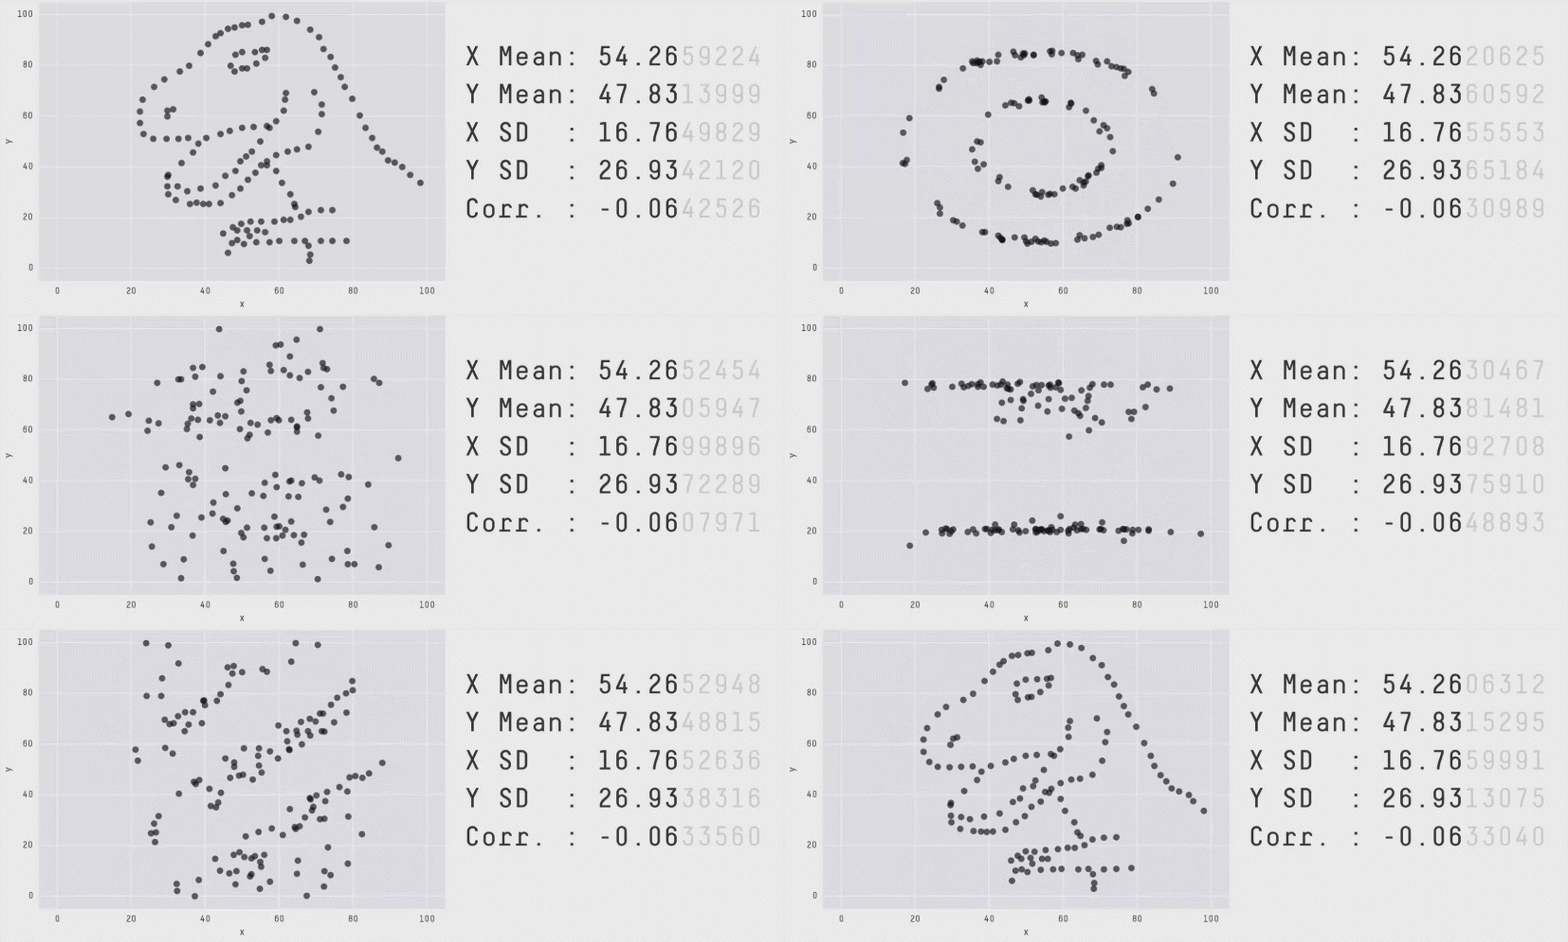
EDA: Why it's worth it
Main arguments of the talk:
- We need software to do research
- Writing research software is a research contribution
- Research software is critically under-funded and not acknowledged.
- We will continue to lose software developers if they are not acknowledged.
- We must fund and acknowledge software
- What does a research software engineer do?
- The history of research software in academia
- What I do in a day to day role
- What Academia, and you, can do to help
I'll discuss why we need to consider software as academic output, what a research software engineer does, how I work in a team of researchers, and some of the practices I have put in place to maintain reproducibility.
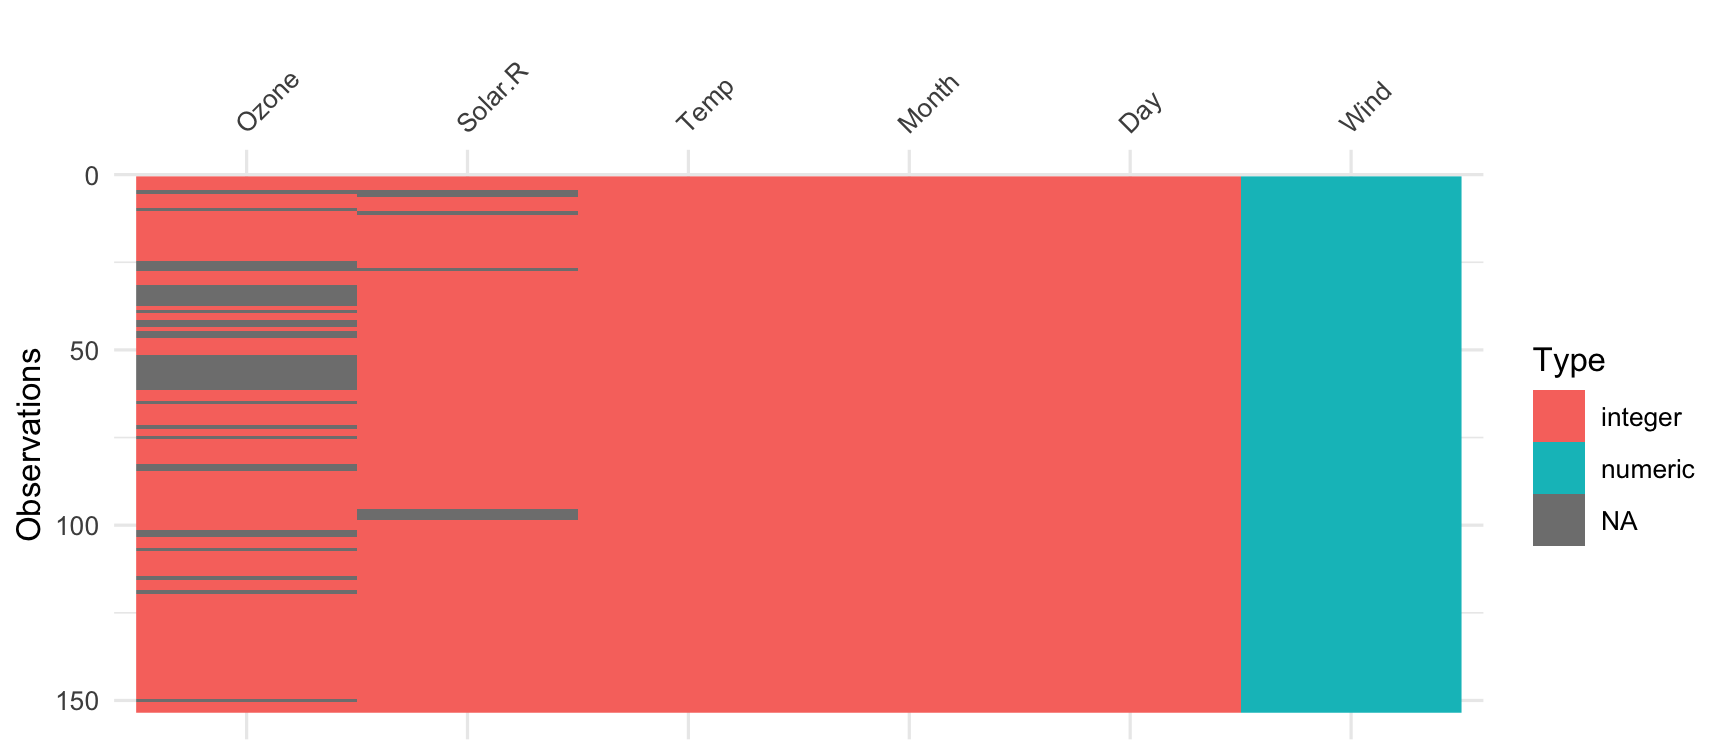
visdat::vis_dat(airquality)
Main arguments of the talk:
- We need software to do research
- Writing research software is a research contribution
- Research software is critically under-funded and not acknowledged.
- We will continue to lose software developers if they are not acknowledged.
- We must fund and acknowledge software
- What does a research software engineer do?
- The history of research software in academia
- What I do in a day to day role
- What Academia, and you, can do to help
I'll discuss why we need to consider software as academic output, what a research software engineer does, how I work in a team of researchers, and some of the practices I have put in place to maintain reproducibility.
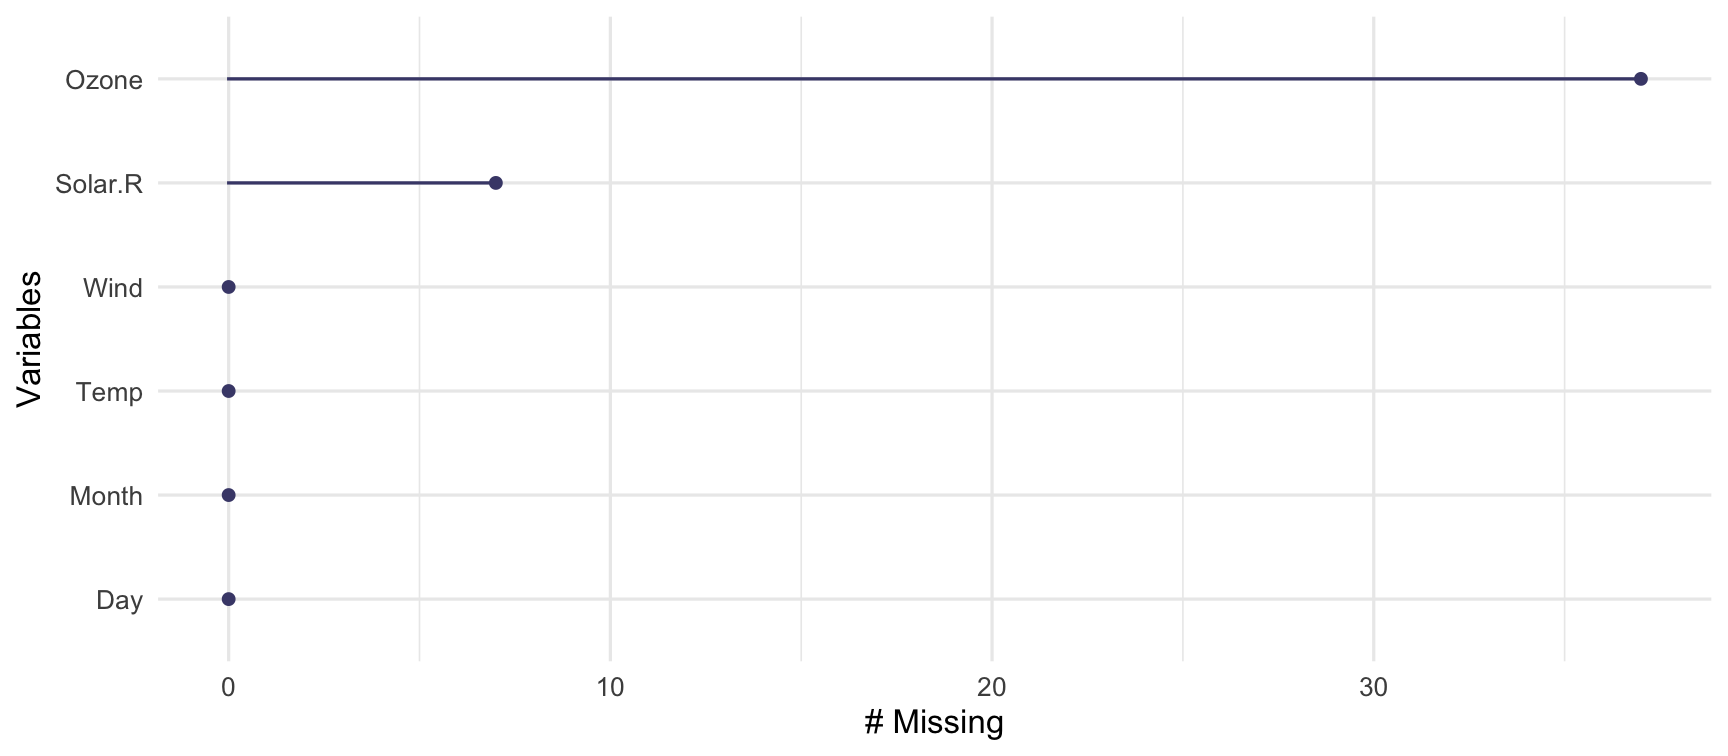
naniar::gg_miss_var(airquality)
Main arguments of the talk:
- We need software to do research
- Writing research software is a research contribution
- Research software is critically under-funded and not acknowledged.
- We will continue to lose software developers if they are not acknowledged.
- We must fund and acknowledge software
- What does a research software engineer do?
- The history of research software in academia
- What I do in a day to day role
- What Academia, and you, can do to help
I'll discuss why we need to consider software as academic output, what a research software engineer does, how I work in a team of researchers, and some of the practices I have put in place to maintain reproducibility.
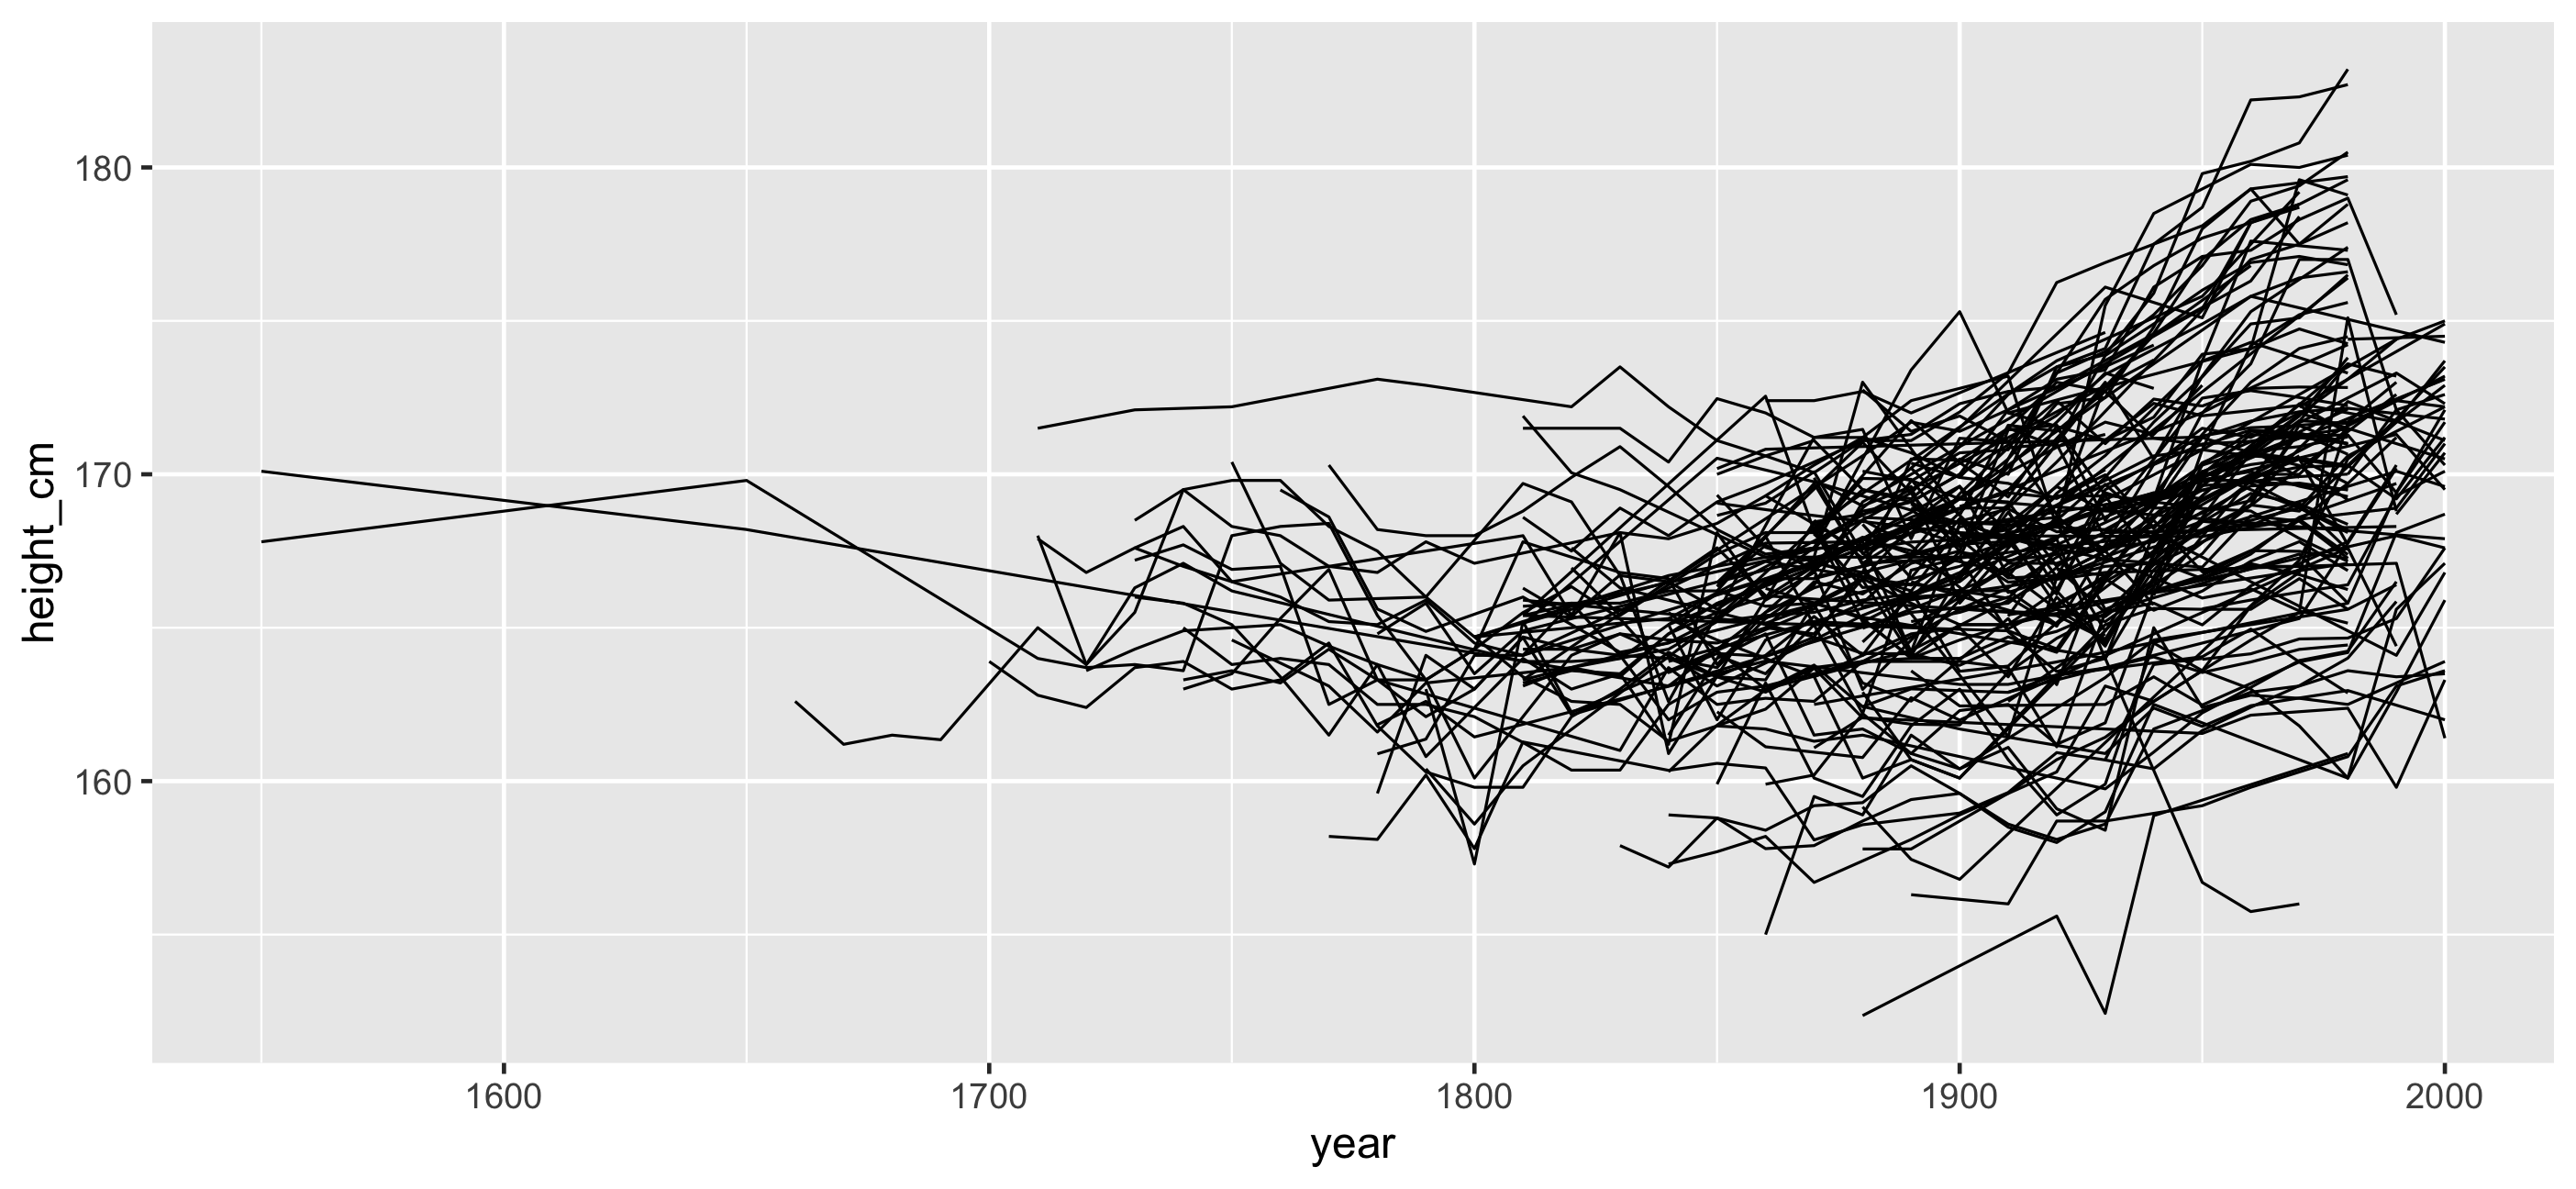
brolgar - take spaghetti
Main arguments of the talk:
- We need software to do research
- Writing research software is a research contribution
- Research software is critically under-funded and not acknowledged.
- We will continue to lose software developers if they are not acknowledged.
- We must fund and acknowledge software
- What does a research software engineer do?
- The history of research software in academia
- What I do in a day to day role
- What Academia, and you, can do to help
I'll discuss why we need to consider software as academic output, what a research software engineer does, how I work in a team of researchers, and some of the practices I have put in place to maintain reproducibility.
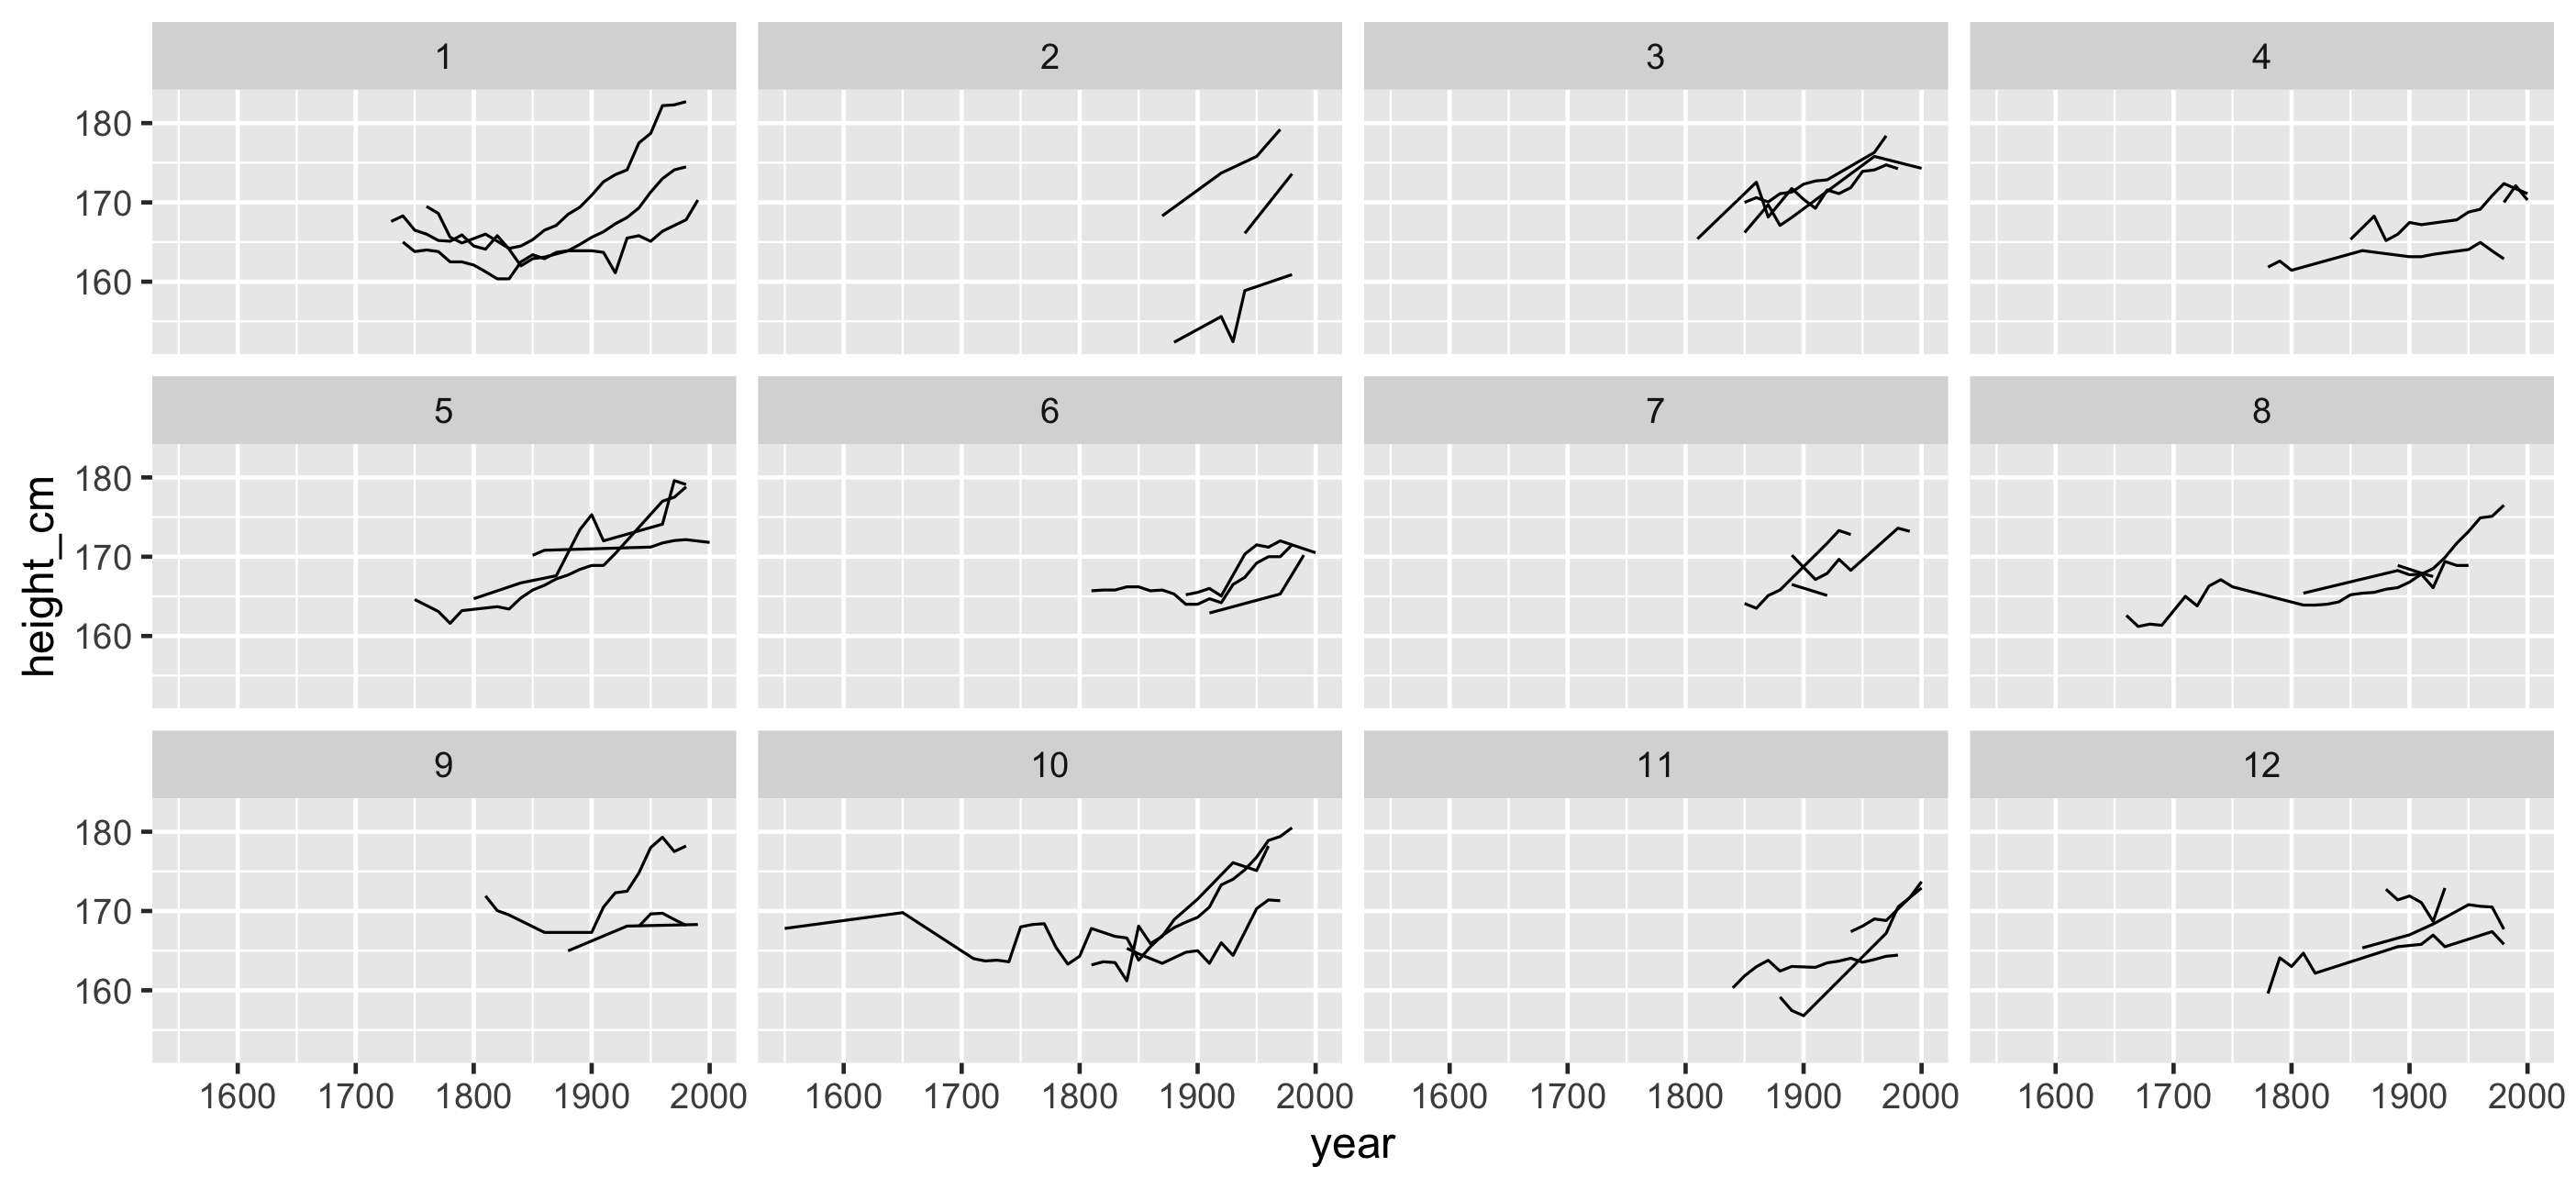
brolgar - sample spaghetti
Main arguments of the talk:
- We need software to do research
- Writing research software is a research contribution
- Research software is critically under-funded and not acknowledged.
- We will continue to lose software developers if they are not acknowledged.
- We must fund and acknowledge software
- What does a research software engineer do?
- The history of research software in academia
- What I do in a day to day role
- What Academia, and you, can do to help
I'll discuss why we need to consider software as academic output, what a research software engineer does, how I work in a team of researchers, and some of the practices I have put in place to maintain reproducibility.
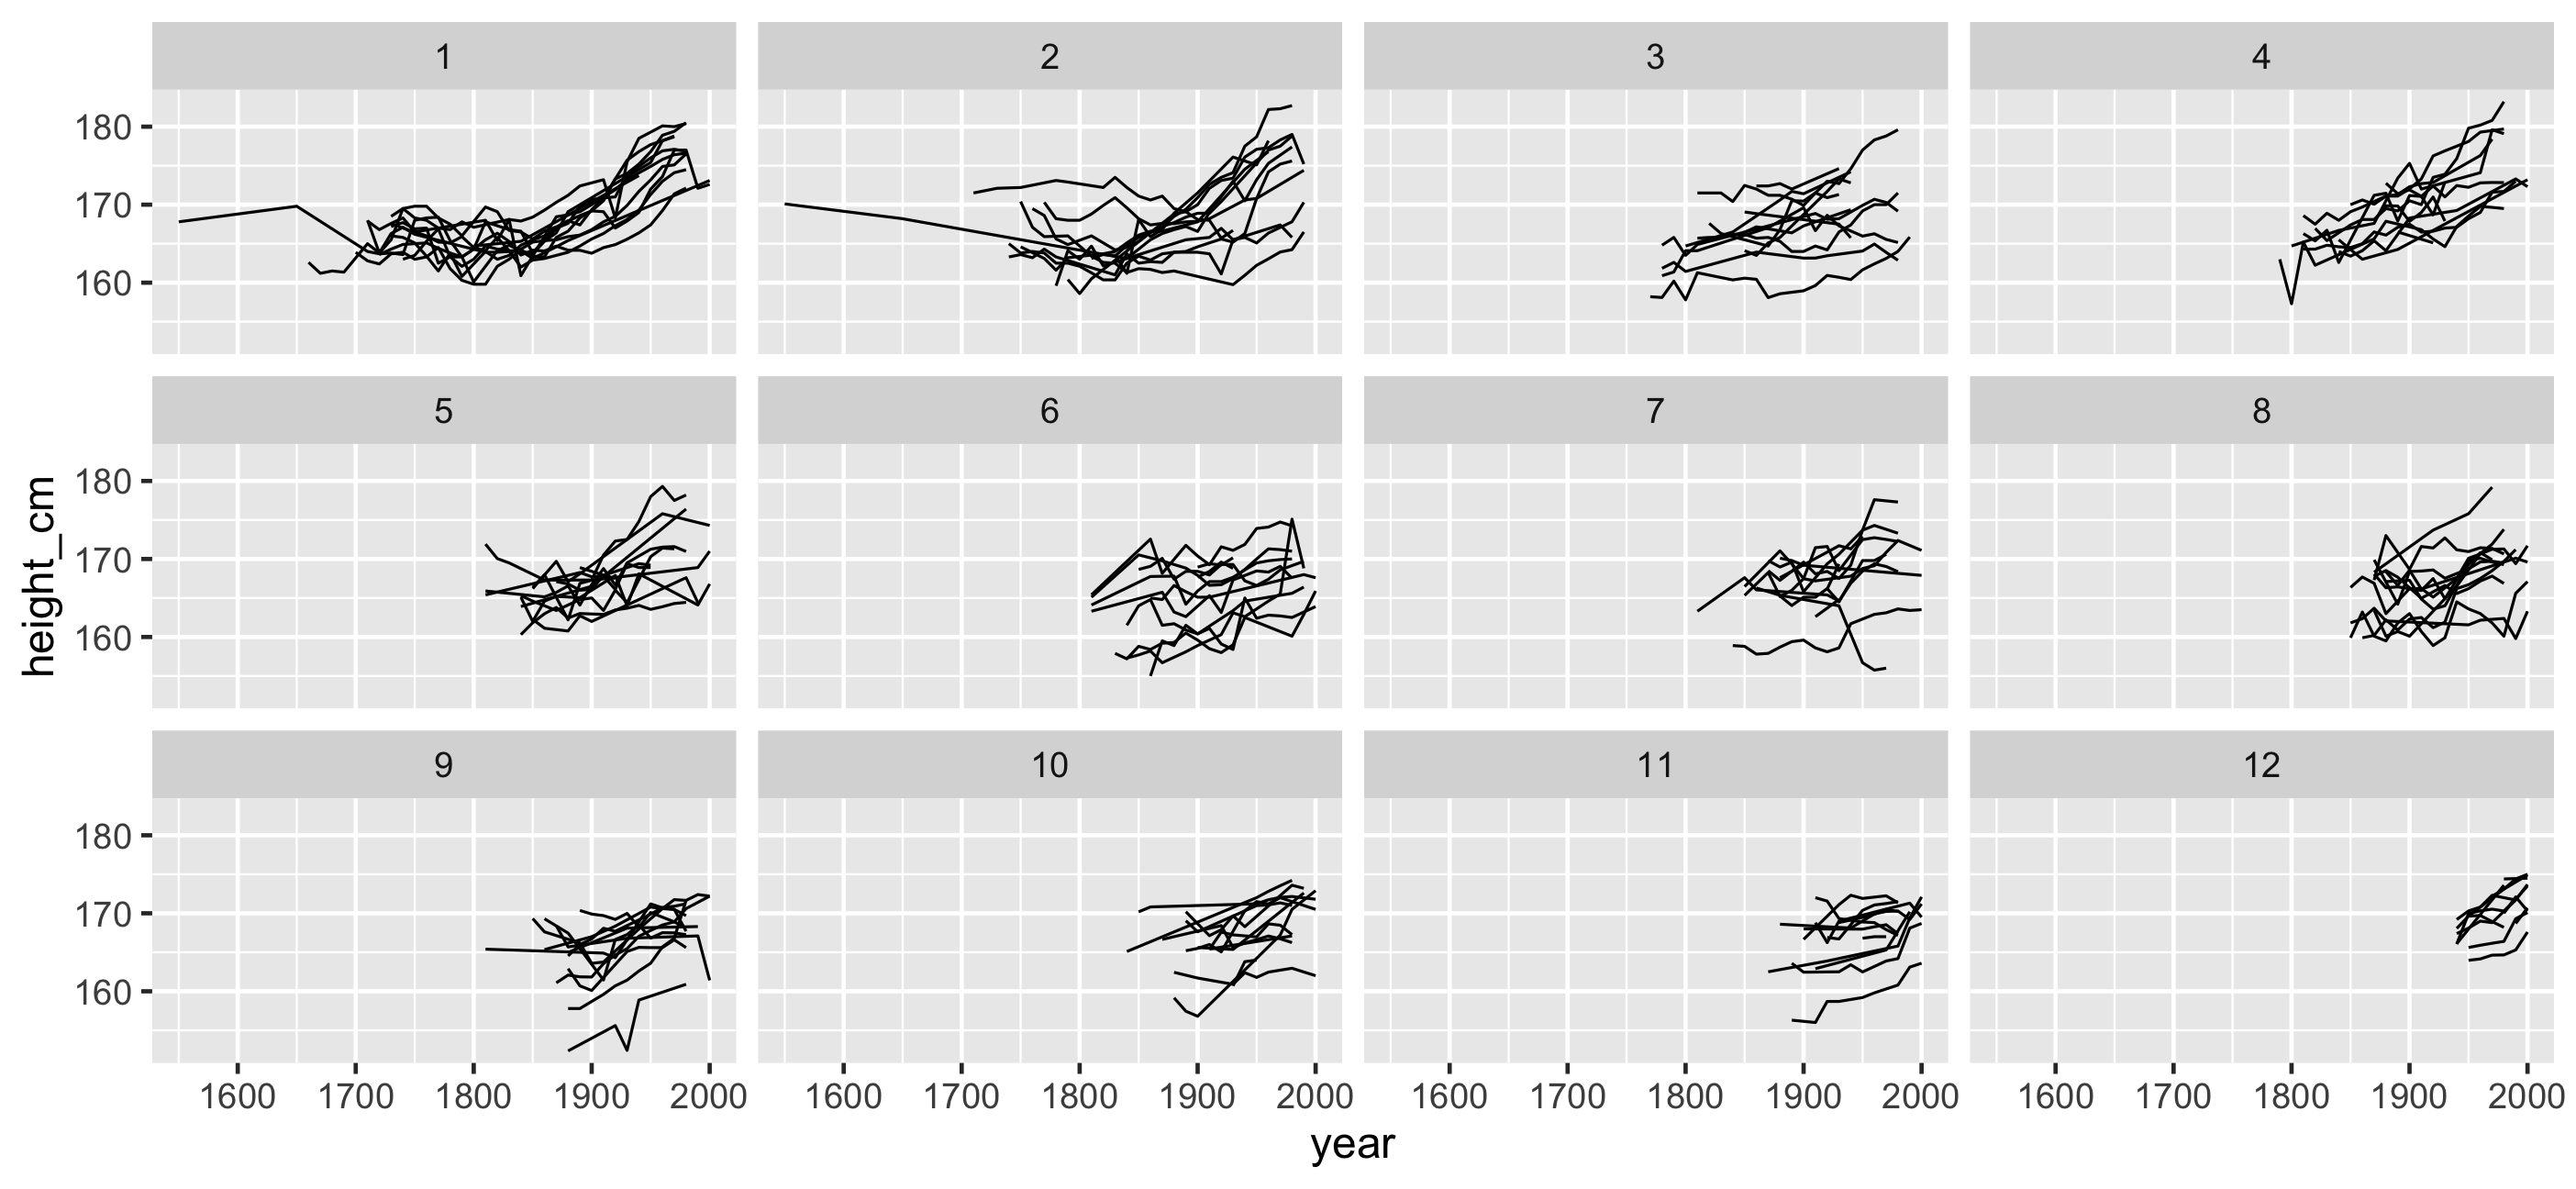
brolgar - spread spaghetti
Main arguments of the talk:
- We need software to do research
- Writing research software is a research contribution
- Research software is critically under-funded and not acknowledged.
- We will continue to lose software developers if they are not acknowledged.
- We must fund and acknowledge software
- What does a research software engineer do?
- The history of research software in academia
- What I do in a day to day role
- What Academia, and you, can do to help
I'll discuss why we need to consider software as academic output, what a research software engineer does, how I work in a team of researchers, and some of the practices I have put in place to maintain reproducibility.
What do I do as an RSE?
Main arguments of the talk:
- We need software to do research
- Writing research software is a research contribution
- Research software is critically under-funded and not acknowledged.
- We will continue to lose software developers if they are not acknowledged.
- We must fund and acknowledge software
- What does a research software engineer do?
- The history of research software in academia
- What I do in a day to day role
- What Academia, and you, can do to help
I'll discuss why we need to consider software as academic output, what a research software engineer does, how I work in a team of researchers, and some of the practices I have put in place to maintain reproducibility.
{greta}: scalable statistical inference
Created by Professor Nick Golding
greta
theta <- normal(0, 32, dim = 2)mu <- alpha + beta * ZX <- normal(mu, sigma)p <- ilogit(theta[1] + theta[2] * X)distribution(y) <- binomial(n, p)Main arguments of the talk:
- We need software to do research
- Writing research software is a research contribution
- Research software is critically under-funded and not acknowledged.
- We will continue to lose software developers if they are not acknowledged.
- We must fund and acknowledge software
- What does a research software engineer do?
- The history of research software in academia
- What I do in a day to day role
- What Academia, and you, can do to help
I'll discuss why we need to consider software as academic output, what a research software engineer does, how I work in a team of researchers, and some of the practices I have put in place to maintain reproducibility.
{greta}: scalable statistical inference
Created by Professor Nick Golding
greta
theta <- normal(0, 32, dim = 2)mu <- alpha + beta * ZX <- normal(mu, sigma)p <- ilogit(theta[1] + theta[2] * X)distribution(y) <- binomial(n, p)BUGS
for(j in 1 : J) { y[j] ~ dbin(p[j], n[j]) logit(p[j]) <- theta[1] + theta[2] * X[j] X[j] ~ dnorm(mu[j], tau) mu[j] <- alpha + beta * Z[j]}theta[1] ~ dnorm(0.0, 0.001)theta[2] ~ dnorm(0.0, 0.001)Main arguments of the talk:
- We need software to do research
- Writing research software is a research contribution
- Research software is critically under-funded and not acknowledged.
- We will continue to lose software developers if they are not acknowledged.
- We must fund and acknowledge software
- What does a research software engineer do?
- The history of research software in academia
- What I do in a day to day role
- What Academia, and you, can do to help
I'll discuss why we need to consider software as academic output, what a research software engineer does, how I work in a team of researchers, and some of the practices I have put in place to maintain reproducibility.
Main arguments of the talk:
- We need software to do research
- Writing research software is a research contribution
- Research software is critically under-funded and not acknowledged.
- We will continue to lose software developers if they are not acknowledged.
- We must fund and acknowledge software
- What does a research software engineer do?
- The history of research software in academia
- What I do in a day to day role
- What Academia, and you, can do to help
I'll discuss why we need to consider software as academic output, what a research software engineer does, how I work in a team of researchers, and some of the practices I have put in place to maintain reproducibility.
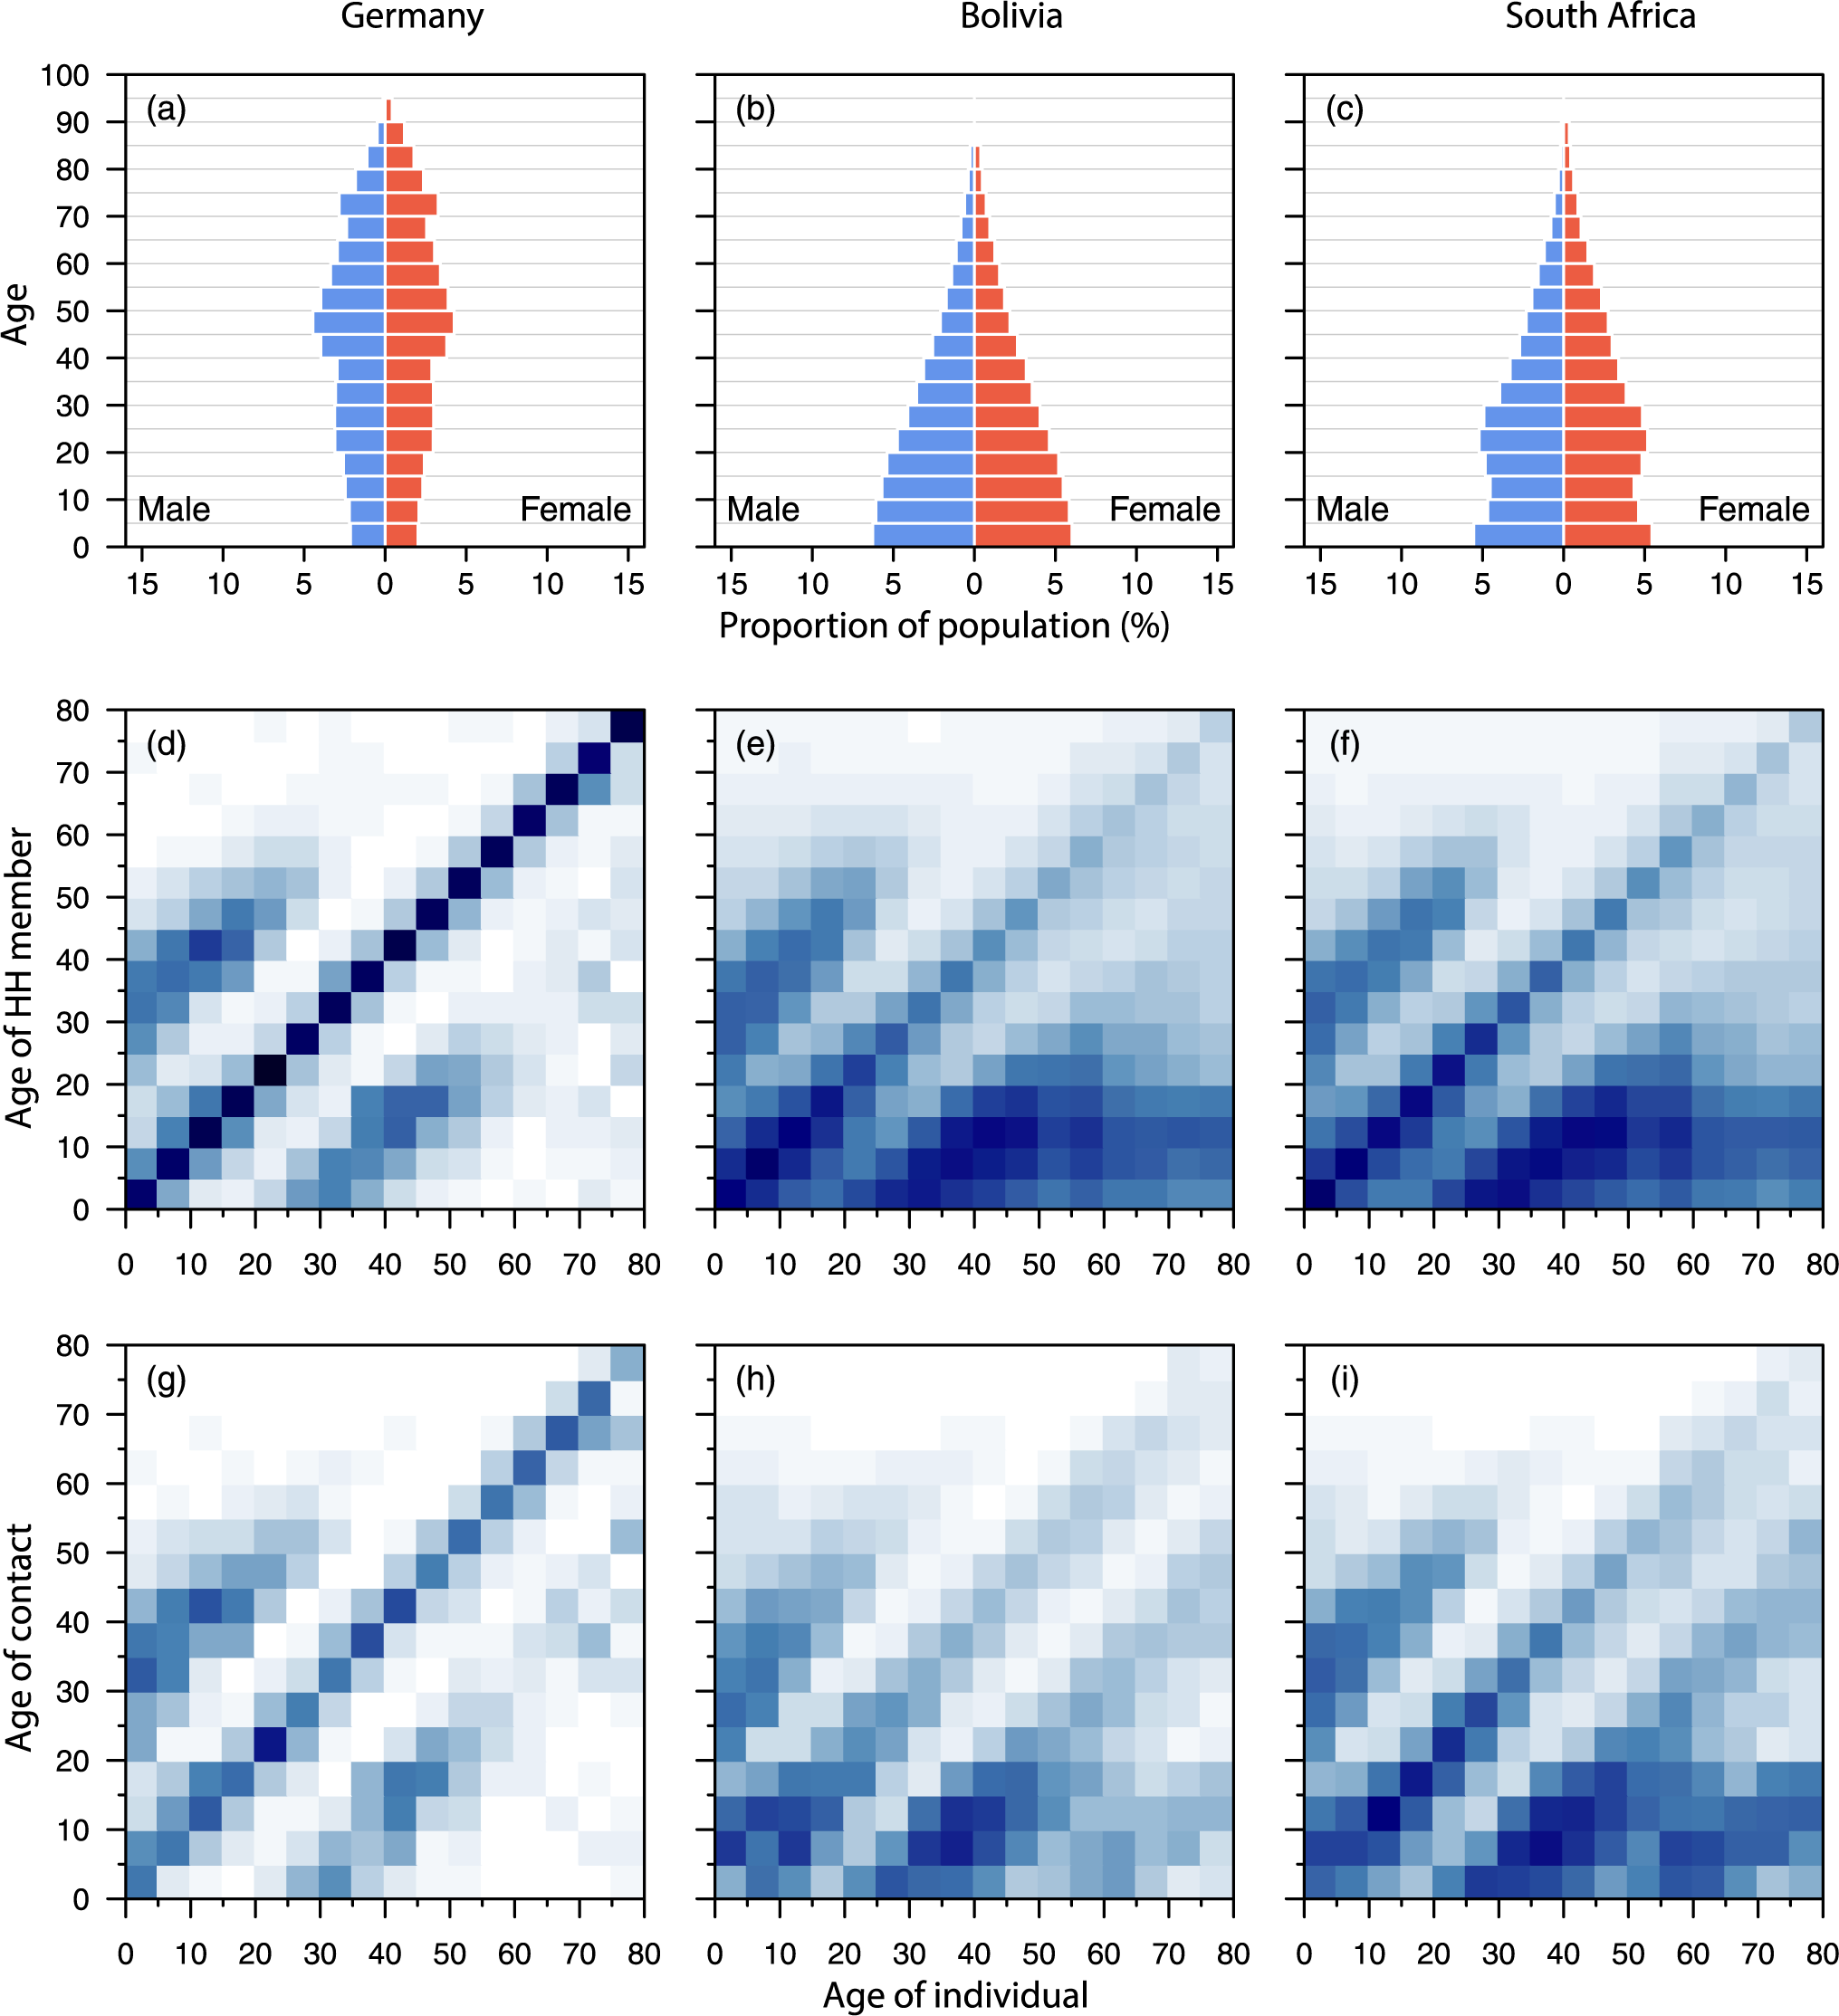
Contact matrices
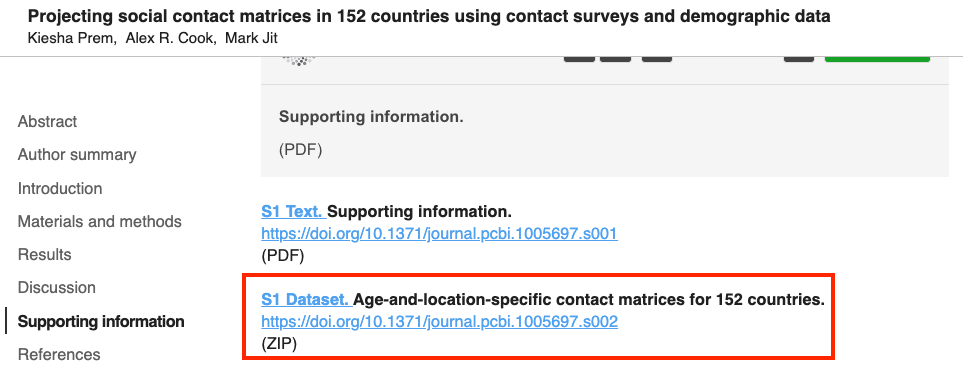
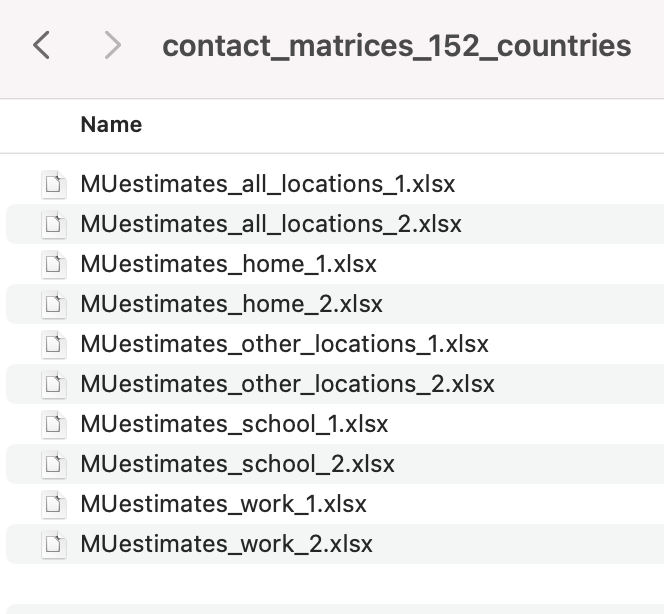
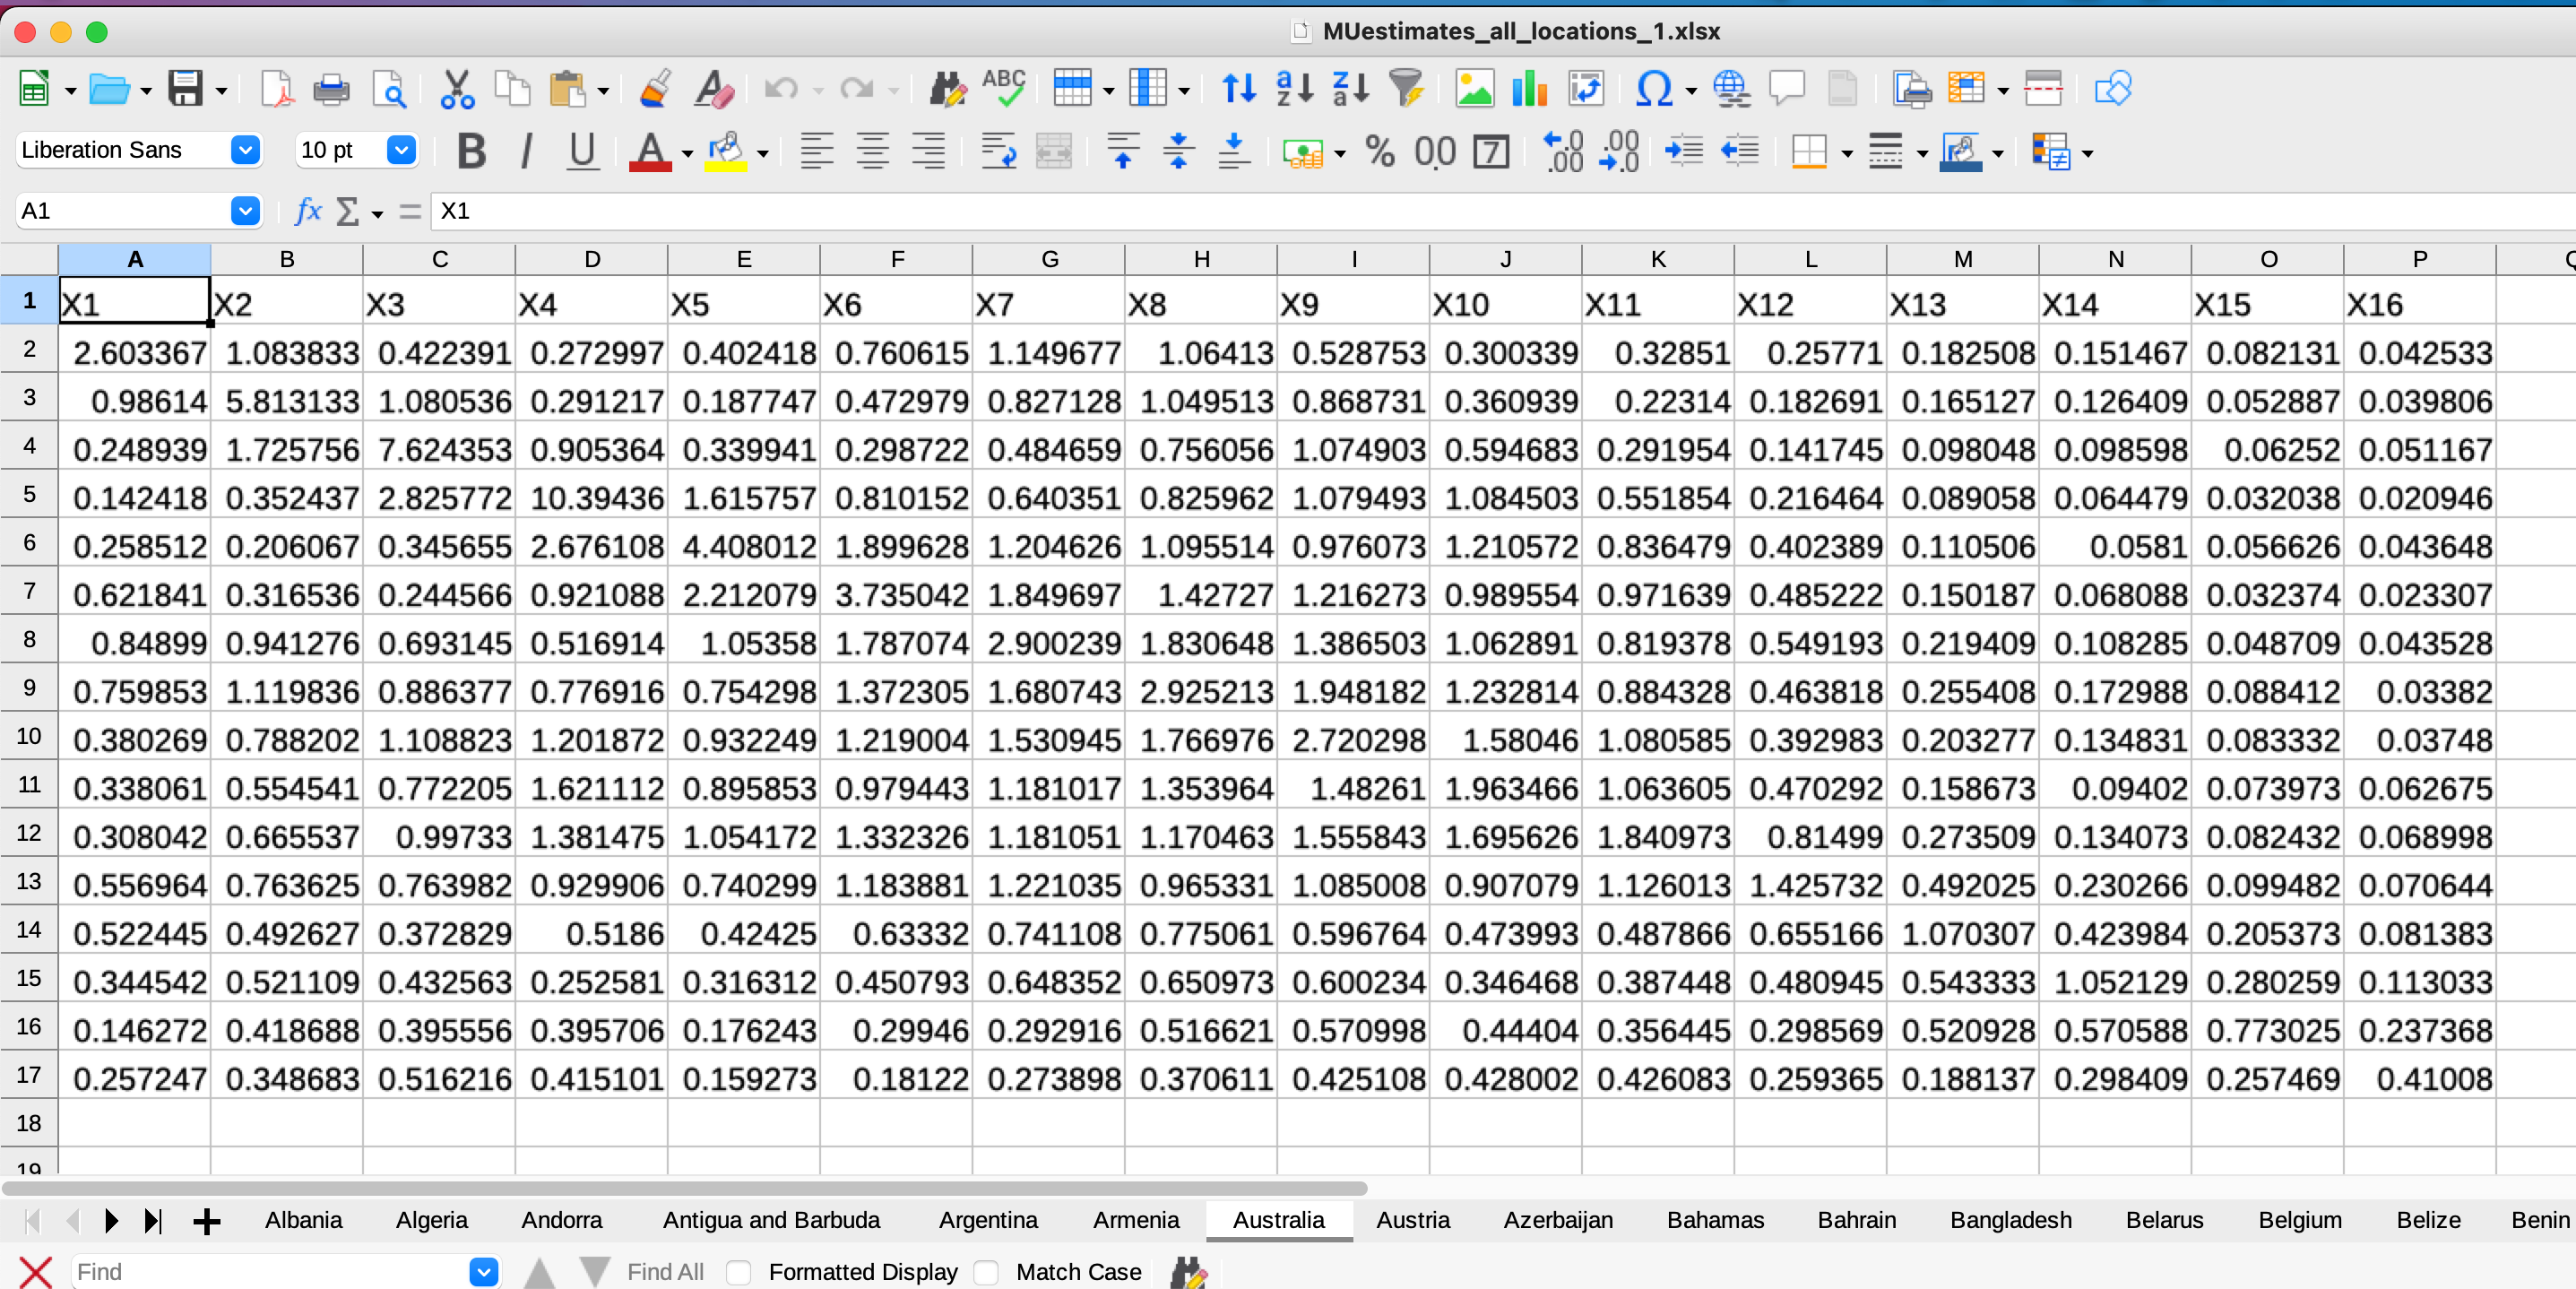
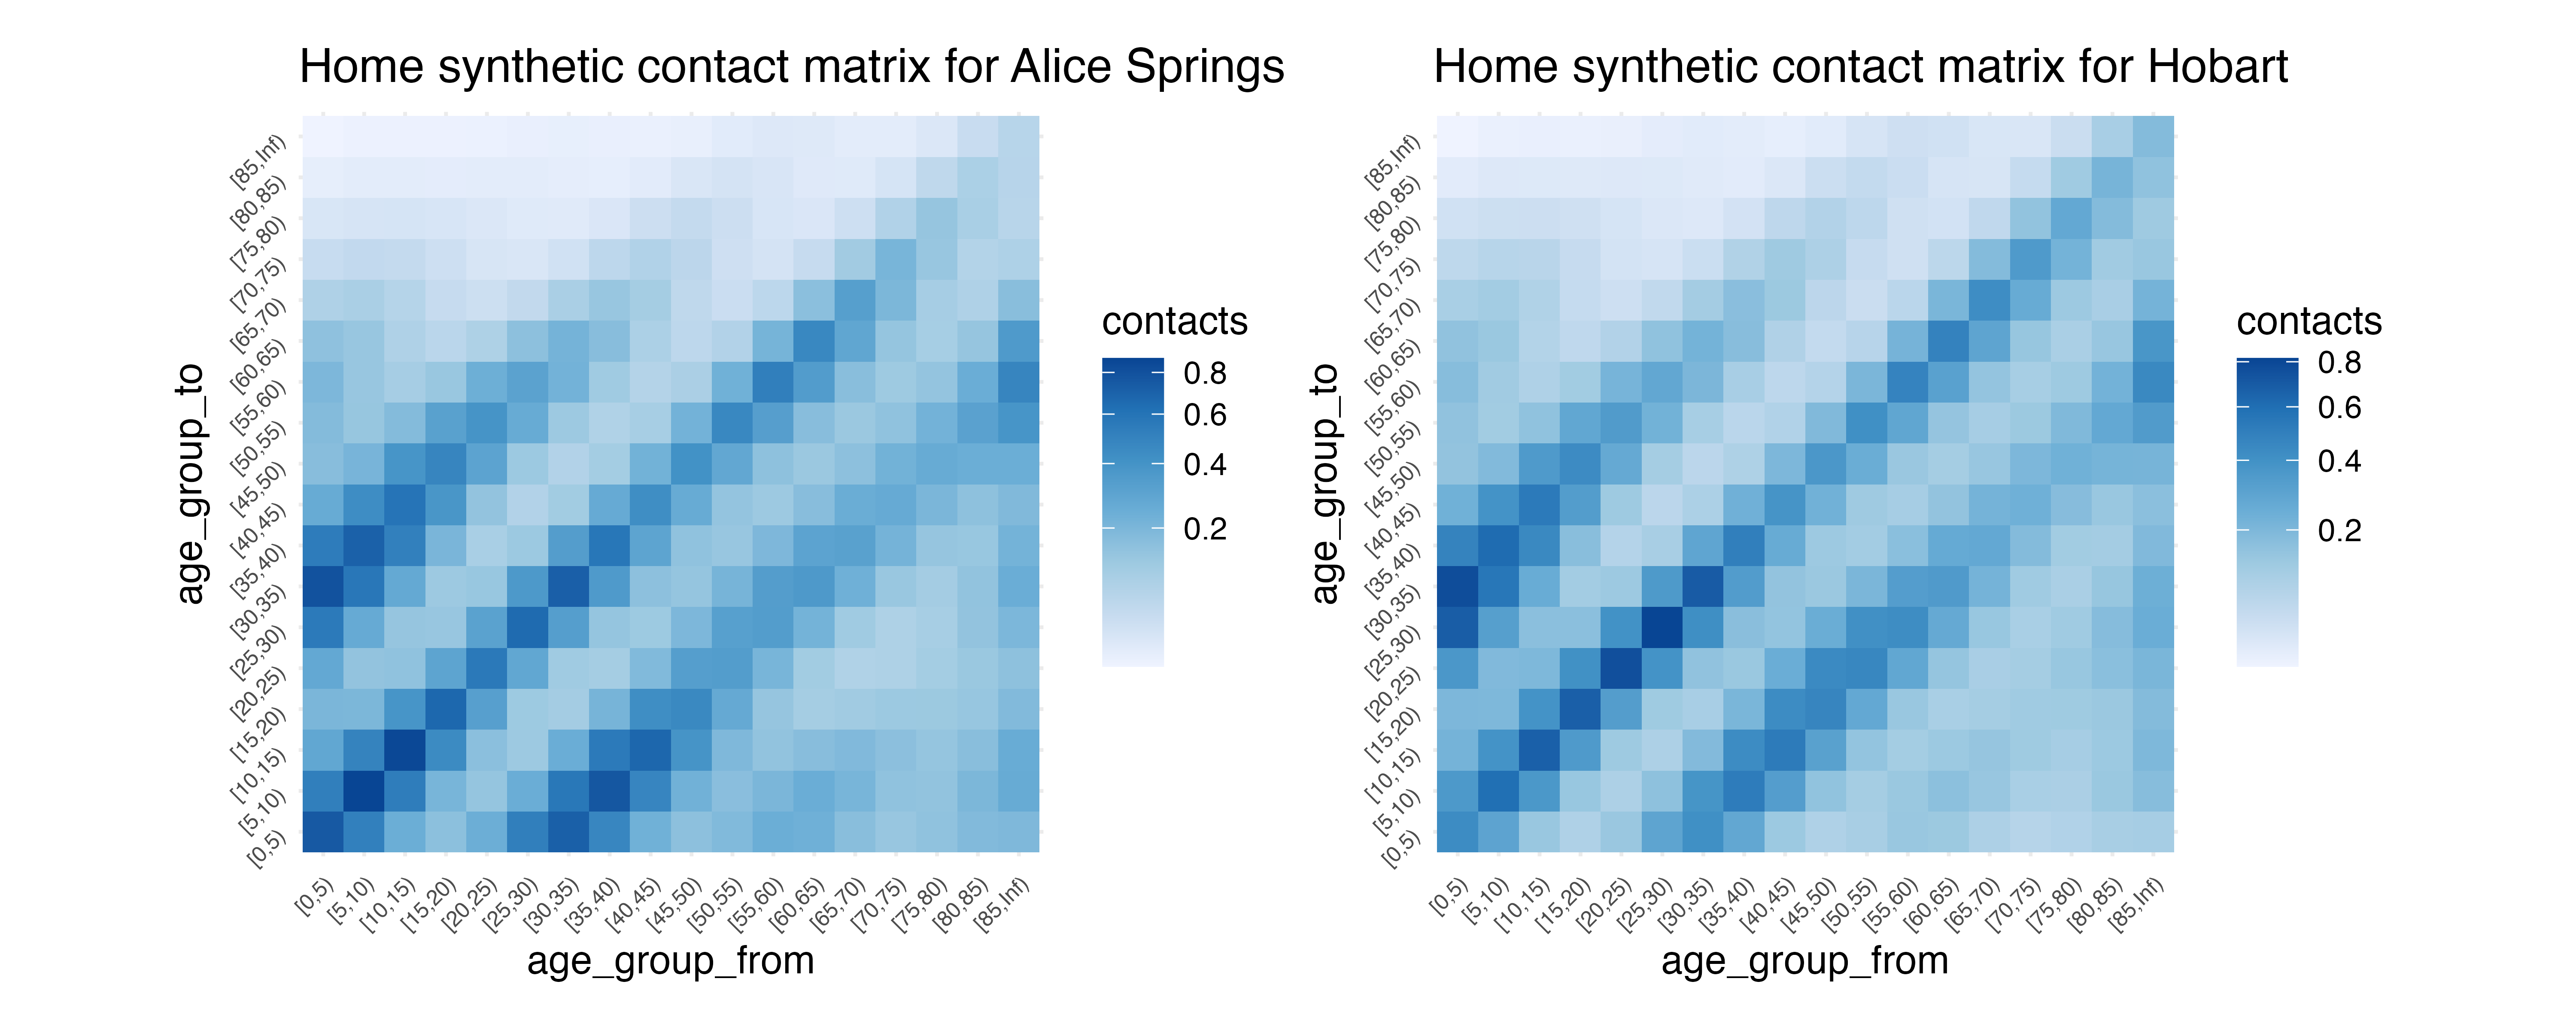
conmat(name in progress) package facilitates contact matrix analysis- Nick Golding contributed statistical modelling
- I implemented package design, infrastructure, tests, documentation
- absolutely critical in recent national covid19 modelling to prime ministers cabinet
- package available on github
Main arguments of the talk:
- We need software to do research
- Writing research software is a research contribution
- Research software is critically under-funded and not acknowledged.
- We will continue to lose software developers if they are not acknowledged.
- We must fund and acknowledge software
- What does a research software engineer do?
- The history of research software in academia
- What I do in a day to day role
- What Academia, and you, can do to help
I'll discuss why we need to consider software as academic output, what a research software engineer does, how I work in a team of researchers, and some of the practices I have put in place to maintain reproducibility.
RSEs are everywhere!
- A lot of people have been doing this for a long time
- It isn't necessarily new,
- But providing a name gives us something to rally behind
- The model "career" doesn't have a lot of evidence yet
- We still need credit
Main arguments of the talk:
- We need software to do research
- Writing research software is a research contribution
- Research software is critically under-funded and not acknowledged.
- We will continue to lose software developers if they are not acknowledged.
- We must fund and acknowledge software
- What does a research software engineer do?
- The history of research software in academia
- What I do in a day to day role
- What Academia, and you, can do to help
I'll discuss why we need to consider software as academic output, what a research software engineer does, how I work in a team of researchers, and some of the practices I have put in place to maintain reproducibility.
Getting credit for software
- Citations are one form of credit
- Google scholar now picks up R packages on CRAN

- Reference R monthly R package downloads with a badge:
- From a university/grant writing/job application perspective:
- Papers (unfortunately) generally count for more beans more than software
Main arguments of the talk:
- We need software to do research
- Writing research software is a research contribution
- Research software is critically under-funded and not acknowledged.
- We will continue to lose software developers if they are not acknowledged.
- We must fund and acknowledge software
- What does a research software engineer do?
- The history of research software in academia
- What I do in a day to day role
- What Academia, and you, can do to help
I'll discuss why we need to consider software as academic output, what a research software engineer does, how I work in a team of researchers, and some of the practices I have put in place to maintain reproducibility.
Getting credit for software
- Citations are one form of credit
- Google scholar now picks up R packages on CRAN

- Reference R monthly R package downloads with a badge:
- From a university/grant writing/job application perspective:
- Papers (unfortunately) generally count for more beans more than software
Monash University has recently started crediting statistical software!
Main arguments of the talk:
- We need software to do research
- Writing research software is a research contribution
- Research software is critically under-funded and not acknowledged.
- We will continue to lose software developers if they are not acknowledged.
- We must fund and acknowledge software
- What does a research software engineer do?
- The history of research software in academia
- What I do in a day to day role
- What Academia, and you, can do to help
I'll discuss why we need to consider software as academic output, what a research software engineer does, how I work in a team of researchers, and some of the practices I have put in place to maintain reproducibility.
Publishing software as a paper
Statistical methods:
- Create a new method
- Write code to implement the new method
- Ensure code is easy to use for other people
- Write documentation for the software
- Write tests to ensure the software works
- Write a paper about the new method, which links the paper to the method, to the software
- The reviewers review the paper
- They typically do not review the software or code
Main arguments of the talk:
- We need software to do research
- Writing research software is a research contribution
- Research software is critically under-funded and not acknowledged.
- We will continue to lose software developers if they are not acknowledged.
- We must fund and acknowledge software
- What does a research software engineer do?
- The history of research software in academia
- What I do in a day to day role
- What Academia, and you, can do to help
I'll discuss why we need to consider software as academic output, what a research software engineer does, how I work in a team of researchers, and some of the practices I have put in place to maintain reproducibility.
Publishing software as a paper: some issues
You are writing many times:
- Write the method
- Write the code
- Iterate on the code interface
- Write the tests
- Write Documentation
- Write a paper
Not guaranteed your code is reviewed
Main arguments of the talk:
- We need software to do research
- Writing research software is a research contribution
- Research software is critically under-funded and not acknowledged.
- We will continue to lose software developers if they are not acknowledged.
- We must fund and acknowledge software
- What does a research software engineer do?
- The history of research software in academia
- What I do in a day to day role
- What Academia, and you, can do to help
I'll discuss why we need to consider software as academic output, what a research software engineer does, how I work in a team of researchers, and some of the practices I have put in place to maintain reproducibility.
Publishing software as a paper: JOSS
Journal of Open Source Software
- Write the code, tests, documentation
- Provide a short 1-2 page abstract.
- The code gets reviewed
- Changes made
- Paper gets accepted
- DOI minted
- Your software is now citable!
- It is free!
The paper provides a link to the software. It means the person can write software and not need to write an entire large paper.
Main arguments of the talk:
- We need software to do research
- Writing research software is a research contribution
- Research software is critically under-funded and not acknowledged.
- We will continue to lose software developers if they are not acknowledged.
- We must fund and acknowledge software
- What does a research software engineer do?
- The history of research software in academia
- What I do in a day to day role
- What Academia, and you, can do to help
I'll discuss why we need to consider software as academic output, what a research software engineer does, how I work in a team of researchers, and some of the practices I have put in place to maintain reproducibility.
rOpenSci Software Review
- More in depth software review backed by their developer guide
- Details on how to review + more here
- Guided walk through
- Example package:
ropenaq
Main arguments of the talk:
- We need software to do research
- Writing research software is a research contribution
- Research software is critically under-funded and not acknowledged.
- We will continue to lose software developers if they are not acknowledged.
- We must fund and acknowledge software
- What does a research software engineer do?
- The history of research software in academia
- What I do in a day to day role
- What Academia, and you, can do to help
I'll discuss why we need to consider software as academic output, what a research software engineer does, how I work in a team of researchers, and some of the practices I have put in place to maintain reproducibility.
rOpenSci Statistical Software Review
- Expand the rOpenSci software review to statistics
- Guide to statistical software peer review
Main arguments of the talk:
- We need software to do research
- Writing research software is a research contribution
- Research software is critically under-funded and not acknowledged.
- We will continue to lose software developers if they are not acknowledged.
- We must fund and acknowledge software
- What does a research software engineer do?
- The history of research software in academia
- What I do in a day to day role
- What Academia, and you, can do to help
I'll discuss why we need to consider software as academic output, what a research software engineer does, how I work in a team of researchers, and some of the practices I have put in place to maintain reproducibility.
Getting credit: Awards / recognition
Main arguments of the talk:
- We need software to do research
- Writing research software is a research contribution
- Research software is critically under-funded and not acknowledged.
- We will continue to lose software developers if they are not acknowledged.
- We must fund and acknowledge software
- What does a research software engineer do?
- The history of research software in academia
- What I do in a day to day role
- What Academia, and you, can do to help
I'll discuss why we need to consider software as academic output, what a research software engineer does, how I work in a team of researchers, and some of the practices I have put in place to maintain reproducibility.
What can you do? How can we help sustain this?
- Research money for maintenance of existing software
- Seed funding for new software ideas
- Are you a reviewers? On grant committees? Heads of school?
- Talk about the importance of software
- Count software when reviewing applications and grants
- cite software when you use it in your research!
- Consider hiring RSEs!
Main arguments of the talk:
- We need software to do research
- Writing research software is a research contribution
- Research software is critically under-funded and not acknowledged.
- We will continue to lose software developers if they are not acknowledged.
- We must fund and acknowledge software
- What does a research software engineer do?
- The history of research software in academia
- What I do in a day to day role
- What Academia, and you, can do to help
I'll discuss why we need to consider software as academic output, what a research software engineer does, how I work in a team of researchers, and some of the practices I have put in place to maintain reproducibility.
it is valuable. I feel that I hear far too many people say, "oh yes, software is super valuable", and then that's it - show us that it is valuable in the same way that people at Monash do. As much as early career researchers like me can try and give talks like this, we can only impart so much change.
Take homes
- We need software to do research
- Writing research software is a research contribution
- Research software is critically underfunded and now acknowledged.
- If we don't acknowledge and support it, we will lose people
- We need to think about how we fund and support those who write software
- RSEs are one path to helping enable and facilitate research impact
- We all need to work together to acknowledge software
Main arguments of the talk:
- We need software to do research
- Writing research software is a research contribution
- Research software is critically under-funded and not acknowledged.
- We will continue to lose software developers if they are not acknowledged.
- We must fund and acknowledge software
- What does a research software engineer do?
- The history of research software in academia
- What I do in a day to day role
- What Academia, and you, can do to help
I'll discuss why we need to consider software as academic output, what a research software engineer does, how I work in a team of researchers, and some of the practices I have put in place to maintain reproducibility.
Thanks
- Nick Golding
- Tasmin Symons
- Miles McBain
- Di Cook
- Rob Hyndman
- Karthik Ram
Main arguments of the talk:
- We need software to do research
- Writing research software is a research contribution
- Research software is critically under-funded and not acknowledged.
- We will continue to lose software developers if they are not acknowledged.
- We must fund and acknowledge software
- What does a research software engineer do?
- The history of research software in academia
- What I do in a day to day role
- What Academia, and you, can do to help
I'll discuss why we need to consider software as academic output, what a research software engineer does, how I work in a team of researchers, and some of the practices I have put in place to maintain reproducibility.
Resources
- Data Science: A Three Ring Circus or a Big Tent?
- A National Agenda for Research Software
- The Origins of SageMath; I am leaving academia to build a company, William Stein
- Fernando Pérez's talk
- My twitter thread asking for resources
- 100 papers published in JOSS
- Journal of Open Source Software (JOSS): design and first-year review
Main arguments of the talk:
- We need software to do research
- Writing research software is a research contribution
- Research software is critically under-funded and not acknowledged.
- We will continue to lose software developers if they are not acknowledged.
- We must fund and acknowledge software
- What does a research software engineer do?
- The history of research software in academia
- What I do in a day to day role
- What Academia, and you, can do to help
I'll discuss why we need to consider software as academic output, what a research software engineer does, how I work in a team of researchers, and some of the practices I have put in place to maintain reproducibility.
Colophon
- Slides made using xaringan
- Extended with xaringanthemer
- Colours taken + modified from lorikeet theme from ochRe
- Header font is Josefin Sans
- Body text font is Montserrat
- Code font is Fira Mono
- template available: njtierney/njt-talks
Main arguments of the talk:
- We need software to do research
- Writing research software is a research contribution
- Research software is critically under-funded and not acknowledged.
- We will continue to lose software developers if they are not acknowledged.
- We must fund and acknowledge software
- What does a research software engineer do?
- The history of research software in academia
- What I do in a day to day role
- What Academia, and you, can do to help
I'll discuss why we need to consider software as academic output, what a research software engineer does, how I work in a team of researchers, and some of the practices I have put in place to maintain reproducibility.
Learning more
Main arguments of the talk:
- We need software to do research
- Writing research software is a research contribution
- Research software is critically under-funded and not acknowledged.
- We will continue to lose software developers if they are not acknowledged.
- We must fund and acknowledge software
- What does a research software engineer do?
- The history of research software in academia
- What I do in a day to day role
- What Academia, and you, can do to help
I'll discuss why we need to consider software as academic output, what a research software engineer does, how I work in a team of researchers, and some of the practices I have put in place to maintain reproducibility.
End.
Main arguments of the talk:
- We need software to do research
- Writing research software is a research contribution
- Research software is critically under-funded and not acknowledged.
- We will continue to lose software developers if they are not acknowledged.
- We must fund and acknowledge software
- What does a research software engineer do?
- The history of research software in academia
- What I do in a day to day role
- What Academia, and you, can do to help
I'll discuss why we need to consider software as academic output, what a research software engineer does, how I work in a team of researchers, and some of the practices I have put in place to maintain reproducibility.
What does academia value?
The incentive structures of academic statistics still signal that mathematical statistics and the creation of new models and inferential procedures are more valuable than work related to data manipulation, visualisation, and programming. This is reflected in the content of for-credit courses, qualifying exams, and standards for funding and promotion.... It can be very difficult to present modern data scientific work as impactful scholarly activity, when the system still defines that primarily as theory and methodology papers.
-- Jenny Bryan & Hadley Wickham
The basic practices of modularity, testing, version control, packaging, and interface design are not mere niceties. They determine whether data scientific products can actually be trusted and built upon, like a proof in mathematics
-- Jenny Bryan & Hadley Wickham
It doesn't matter how good a theoretical solution is, unless there are practical tools that implement it. We must also recognise that humans are an essential part of the data science process and study how they can interact with the computer most effectively. Finding useful abstractions and exposing them through programming languages is an important part of this process
-- Jenny Bryan & Hadley Wickham
Data Science: A Three Ring Circus or a Big Tent?
Having RSEs in your team
- Proactive vs Reactive research software
- Proactive: designs code that can be maintaed easily, for 10 years, is documented well, is tested, is maintainable
- Reactive: taking existing code and cleaning it up so it can be used for other use cases
- More haste less speed: do it well so you can do it quickly
- Examples of the types of RSE projects
- What sort of skillset they need, and how it contributes to reserach impacrt
- How would having an RSE inprove the impact of the work?
